Off topic : visual diagrams anyone ???
71 views
Skip to first unread message

António Ramos
Nov 27, 2019, 12:58:48 PM11/27/19
to web...@googlegroups.com

Scott Hunter
Dec 1, 2019, 9:57:12 PM12/1/19
to web2py-users
What is stopping you from using it *in* your web2py app?
António Ramos
Dec 2, 2019, 4:51:42 AM12/2/19
to web...@googlegroups.com
Nothing , im am using it already.
Just sharing it with you...
:)
--
Resources:
- http://web2py.com
- http://web2py.com/book (Documentation)
- http://github.com/web2py/web2py (Source code)
- https://code.google.com/p/web2py/issues/list (Report Issues)
---
You received this message because you are subscribed to the Google Groups "web2py-users" group.
To unsubscribe from this group and stop receiving emails from it, send an email to web2py+un...@googlegroups.com.
To view this discussion on the web visit https://groups.google.com/d/msgid/web2py/a6b5dc62-e78b-47ff-a450-97ad0aafab95%40googlegroups.com.

Dave S
Dec 3, 2019, 3:43:05 AM12/3/19
to web2py-users
On Monday, December 2, 2019 at 1:51:42 AM UTC-8, Ramos wrote:
Nothing , im am using it already.Just sharing it with you...:)
Any particular advice on how to use with web2py app, or did you find that information at the link was sufficient?
/dps
Em seg., 2 de dez. de 2019 às 02:57, Scott Hunter <shu...@nycap.rr.com> escreveu:
What is stopping you from using it *in* your web2py app?--
On Wednesday, November 27, 2019 at 12:58:48 PM UTC-5, Ramos wrote:
Resources:
- http://web2py.com
- http://web2py.com/book (Documentation)
- http://github.com/web2py/web2py (Source code)
- https://code.google.com/p/web2py/issues/list (Report Issues)
---
You received this message because you are subscribed to the Google Groups "web2py-users" group.
To unsubscribe from this group and stop receiving emails from it, send an email to web...@googlegroups.com.
António Ramos
Dec 3, 2019, 5:49:50 AM12/3/19
to web...@googlegroups.com
havent gone far with it but i intend to automate the generation of diagrams.
So far i´m statically coding a diagram like the following
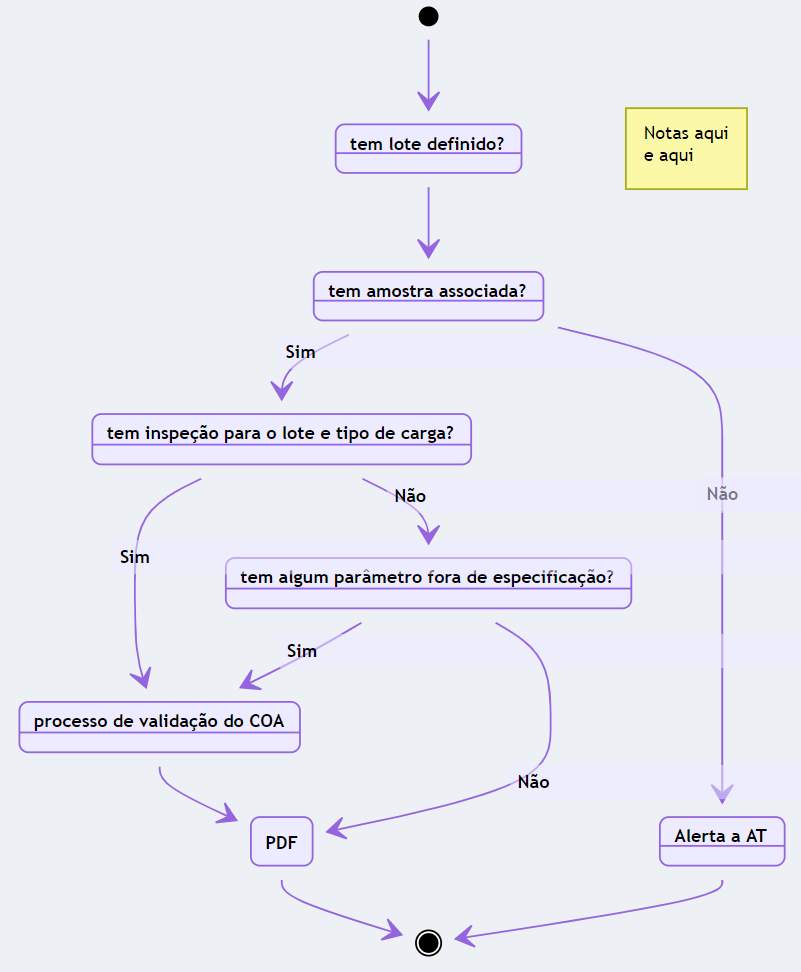
was produced by just this code
<div class="mermaid">
stateDiagram
[*] --> Lote
Lote --> Amostra
Amostra --> Inspeção:Sim
Amostra --> Alerta:Não
Inspeção -->COA:Sim
Inspeção -->Parâmetro:Não
Parâmetro -->COA:Sim
Parâmetro -->PDF:Não
COA -->PDF
PDF --> [*]
Alerta --> [*]
Lote:tem lote definido?
note right of Lote
Notas aqui
e aqui
end note
Inspeção:tem inspeção para o lote e tipo de carga?
Amostra:tem amostra associada?
Alerta:Alerta a AT
Parâmetro:tem algum parâmetro fora de especificação?
COA:processo de validação do COA
</div>
To unsubscribe from this group and stop receiving emails from it, send an email to web2py+un...@googlegroups.com.
To view this discussion on the web visit https://groups.google.com/d/msgid/web2py/80e6651d-776b-4253-8d10-32ee58f84643%40googlegroups.com.

Christian Varas
Dec 3, 2019, 8:01:31 AM12/3/19
to web...@googlegroups.com
Hi, for this I use visjs https://visjs.org you can change the form of the node, pu icons, images change lines to arrow etc.., I've developed a custom note taking app, that makes a mind map when you add notes.
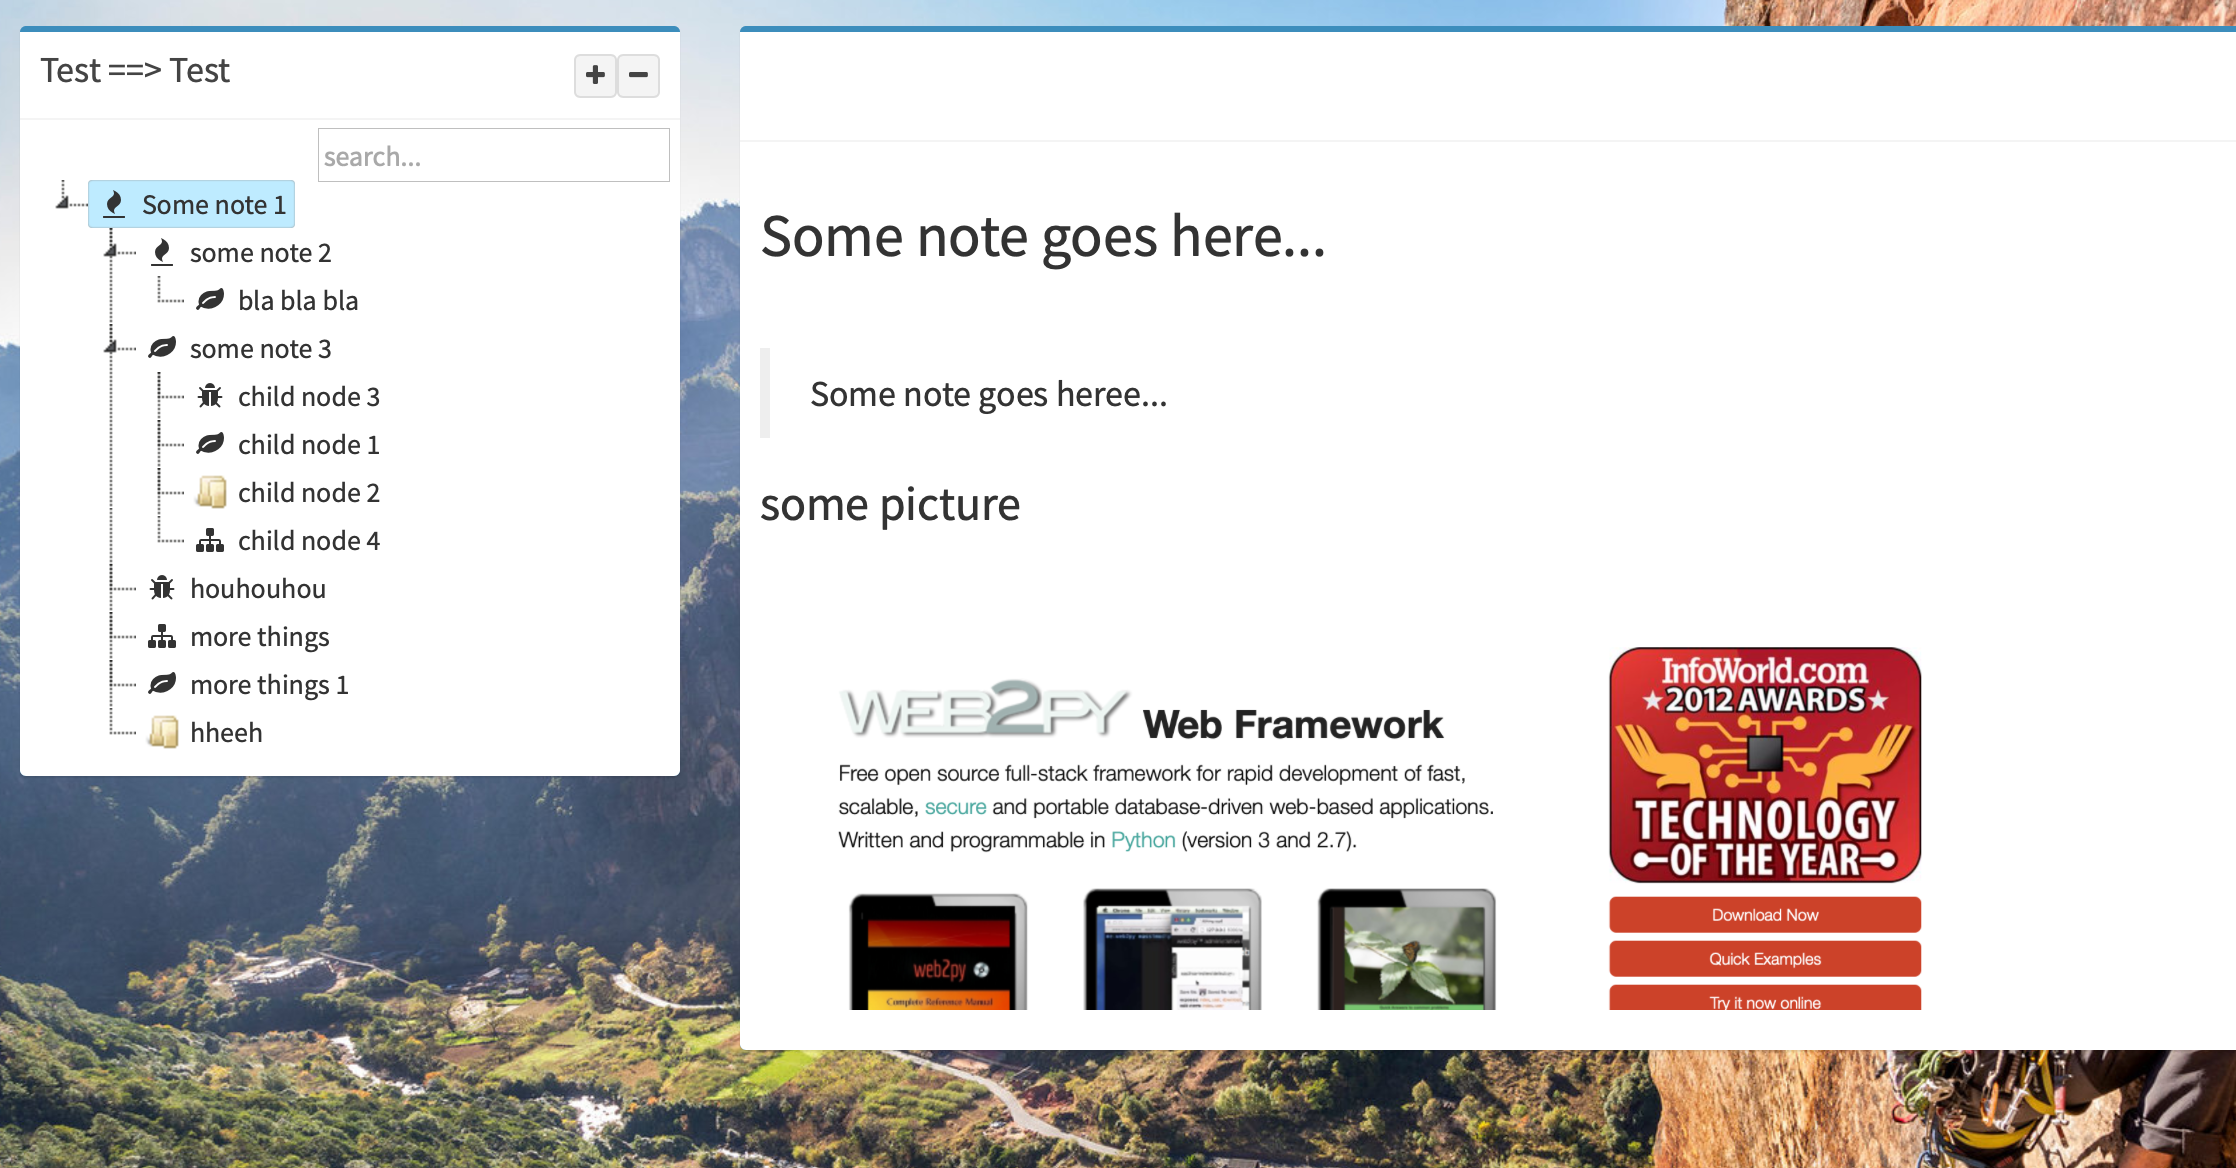
Example:
Every time I add a note, its create a node in the mindmap view
(using jstree to show notes)
Mind map view
javascript for this is really easy, first you add nodes, and then the relations,
In visjs page there is a lot of examples of configuration, and how to catch the events to make an action in the backend (like changing the color of the view, save the position, change shape, etc..)
This is from visjs page, not from the previous screenshots.<script type="text/javascript">
// create an array with nodes
var nodes = new vis.DataSet([
{ id: 1, label: "Node 1" },
{ id: 2, label: "Node 2" },
{ id: 3, label: "Node 3" },
{ id: 4, label: "Node 4" },
{ id: 5, label: "Node 5" }
]);
// create an array with edges
var edges = new vis.DataSet([
{ from: 1, to: 3 },
{ from: 1, to: 2 },
{ from: 2, to: 4 },
{ from: 2, to: 5 },
{ from: 3, to: 3 }
]);
// create a network
var container = document.getElementById("mynetwork");
var data = {
nodes: nodes,
edges: edges
};
var options = {};
var network = new vis.Network(container, data, options);
</script>you can configure visjs to make what you need, changing the shape of the node and adding arrows to the relations lines.
Cheers.
Chris.
To view this discussion on the web visit https://groups.google.com/d/msgid/web2py/CAEM0BxN%3D2t3RG4zt5PJrFVp-KzdfLnd81KUfHJYo-4SEQiKyQw%40mail.gmail.com.
Dave S
Dec 3, 2019, 10:21:26 PM12/3/19
to web2py-users
On Tuesday, December 3, 2019 at 5:01:31 AM UTC-8, Christian Varas wrote:
Hi, for this I use visjs https://visjs.org you can change the form of the node, pu icons, images change lines to arrow etc.., I've developed a custom note taking app, that makes a mind map when you add notes.Example:Every time I add a note, its create a node in the mindmap view(using jstree to show notes)
An interesting example, as is Ramos. I have used Vue (at that point, a freeware item from a college that was exploring visualizations; I have to track down which disk it is archived on) which i found on an old search for mindmap stuff, and before that the tool Word eventually sucked in.
I'd be interested in further understanding what mindmap means for you, but that seems a bit off-topic.
Dave S
/dps
Reply all
Reply to author
Forward
0 new messages