Shards failed

Felipe Andres Concha Sepúlveda

Felipe Andres Concha Sepúlveda
El 29-11-2018, a las 15:19, Felipe Andres Concha Sepúlveda <felipeandresc...@gmail.com> escribió:
Hello everyone I hope you are very well.I'm having a problem with kibana, I can not see the alerts, I get this message "5 of 425 shares failed, I do not know what is due (SEE IMAGE1)recently we had two problems: the first disk space, to solve that we changed the address pointing to another disk in Elasticsearch.yml and the second problem we had was that someone from our team created some indexes in ElasticSearch and blocked our elasticsearch, to solve this we execute the following script:PUT * / _ settings{"index.blocks.read_only_allow_delete": null}After this the system was working well, but now we have this problem in kibana, will it be related?I see my cluster indicators and everything looks good.but I have a log in Logstash with some errors (SEE PICTURE 2)Do you have any idea of this problem?IMAGEN 1
<PastedGraphic-7.png>

Nicholai Tailor
--
You received this message because you are subscribed to the Google Groups "Wazuh mailing list" group.
To unsubscribe from this group and stop receiving emails from it, send an email to wazuh+un...@googlegroups.com.
To post to this group, send email to wa...@googlegroups.com.
Visit this group at https://groups.google.com/group/wazuh.
To view this discussion on the web visit https://groups.google.com/d/msgid/wazuh/A42A3CFE-DE0F-4CC2-9ECD-F0F1078A1278%40gmail.com.
For more options, visit https://groups.google.com/d/optout.
Felipe Andres Concha Sepúlveda


jesus.g...@wazuh.com
Hi Felipe,
First of all, I can see a huge amount of data in your disk, you should review this because Elasticsearch applies
a “watermark” and it prevents from indexing more data. Increase your disk or delete old indices.
Delete an index:
curl -XDELETE elastic:9200/<index>
Regarding the shards allocation, you may want to use the next curl command:
curl elastic:9200/_cluster/health
This provides you a useful information about your cluster. Even better:
watch -n0 'curl elastic:9200/_cluster/health -s'
Once the cluster is upgraded or modified, it could fall into a recovery status, and depending on the amount of data it may take a bit long.
Best regards,
Jesús
El viernes, 30 de noviembre de 2018, 9:27:34 (UTC+1), Felipe Andres Concha Sepúlveda escribió:
Yes, I thought it was not going to be very frequent but today I have it again ...Another thing that I have done this last time is to enable the option "monitoring", when I activated it told me that I would enable xpack and before when I configured my cluster, there was an option to enable the cluster with or without xpack ... I do not know if this It may be the problem, although the habilitation was done by kibana ... there should be no problem, I think.Well, if you have any ideas please let me know

El 29-11-2018, a las 20:49, Nicholai Tailor <nichola...@gmail.com> escribió:
Hi Felipe,The same thing happened to me when I upgraded.It was there for awhile and then disappears.I'm guessing it has to do with the indicies, new ones are created and the problem seems to resolve itself.Cheers
On Thu, Nov 29, 2018 at 4:11 PM Felipe Andres Concha Sepúlveda <felipeandresconchasepulveda@gmail.com> wrote:
The problem now does not exist anymore :)And we did not do anything, do you know what can happen?
Regards
To unsubscribe from this group and stop receiving emails from it, send an email to wazuh+unsubscribe@googlegroups.com.
Felipe Andres Concha Sepúlveda
{
"index.blocks.read_only_allow_delete": null
}
IMAGEN 1

IMAGEN2

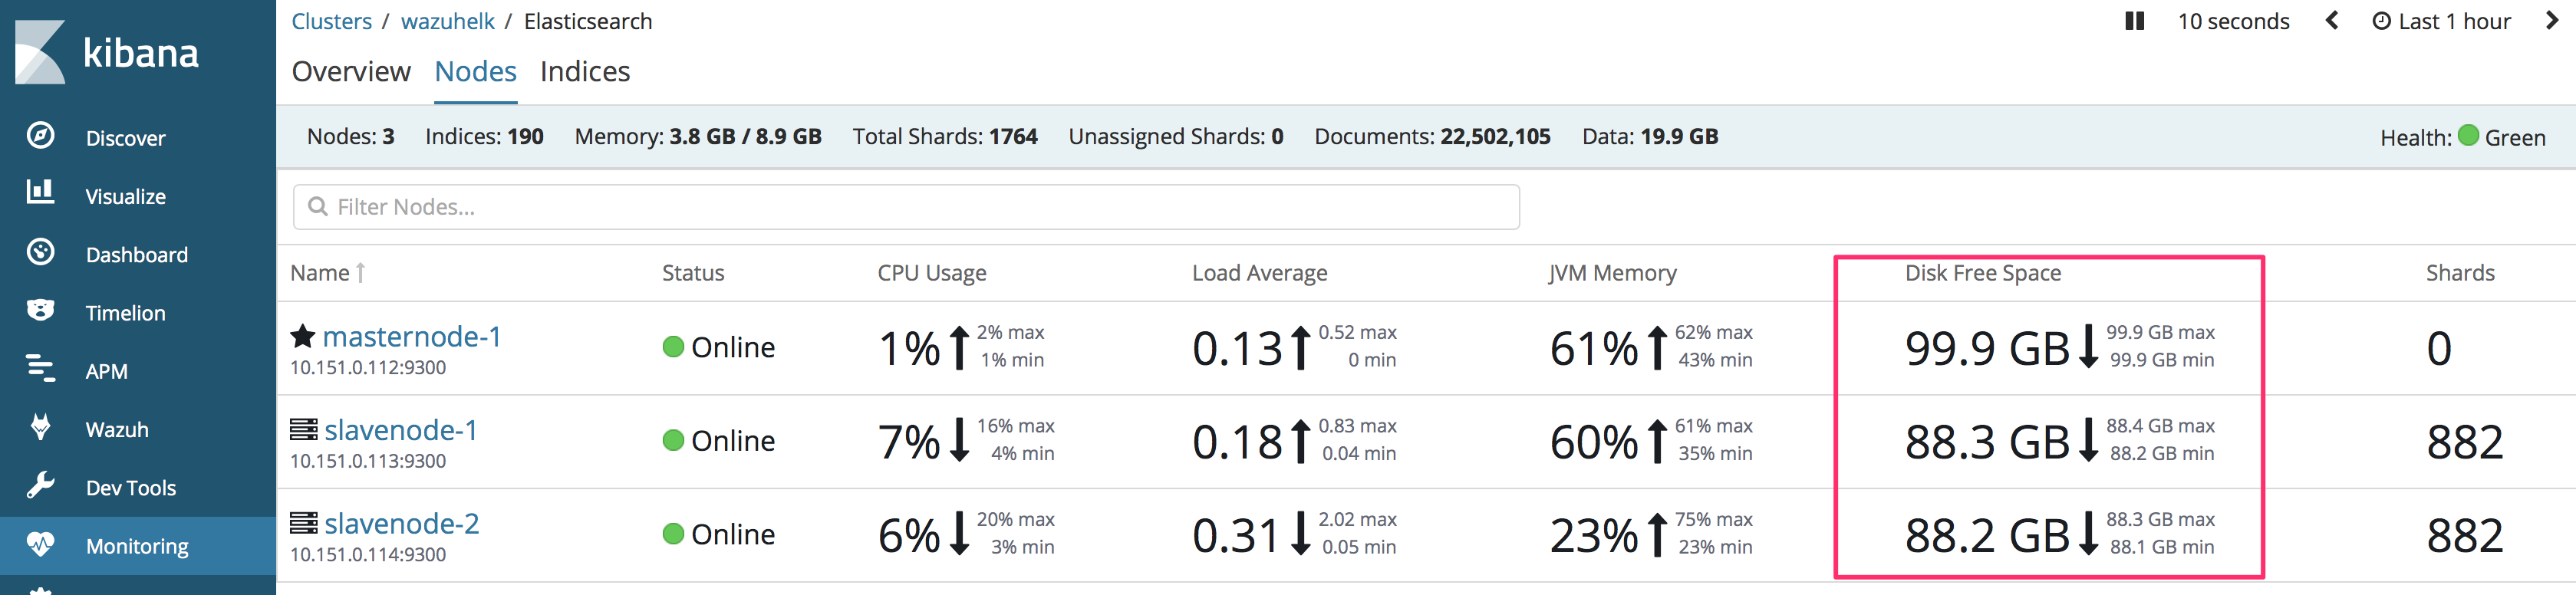


IMAGEN 9
IMAGEN 10

To unsubscribe from this group and stop receiving emails from it, send an email to wazuh+un...@googlegroups.com.
To post to this group, send email to wa...@googlegroups.com.
Visit this group at https://groups.google.com/group/wazuh.
To view this discussion on the web visit https://groups.google.com/d/msgid/wazuh/3ed5aa78-367a-4664-9637-8bc3235d639d%40googlegroups.com.
jesus.g...@wazuh.com
Hi Felipe,
Sounds good, Elasticsearch is a bit complicated but day by day we are trying to make life easier for our community.
I understand that your environment is working just fine but you want to share with us some logs and screenshots just for knowledge
sharing, right?
In any case, I’m going to review all your posted images to provide a technical comment and I hope it helps you and everyone reading this thread:
Picture #1 / #2
- The movement from your Elasticsearch data to another partition is not so clear in your picture, I want to point that you must edit the file
/etc/elasticsearch/elasticsearch.yml and modify thepath.data` value.
Picture #3
- It’s fine but keep in mind that not all the people have the monitoring features available, that’s why I always suggest checking some useful
curlcommands directly to the Elasticsearch API:
GET _cluster/health?pretty
{
"cluster_name": "wazuh-cluster",
"status": "green",
"timed_out": false,
"number_of_nodes": 3,
"number_of_data_nodes": 3,
"active_primary_shards": 667,
"active_shards": 1330,
"relocating_shards": 0,
"initializing_shards": 0,
"unassigned_shards": 0,
"delayed_unassigned_shards": 0,
"number_of_pending_tasks": 0,
"number_of_in_flight_fetch": 0,
"task_max_waiting_in_queue_millis": 0,
"active_shards_percent_as_number": 100
}
Picture #4 / #5
Same as we were talking in Picture #3
Picture #6
Messages like Perhaps Elasticsearch is unreachable or down? means that Elasticsearch is mostly unreachable for any reason: network problem, unfinished recovery, still restarting…
Picture #7 / #8
This is mostly related to Picture #6, Elasticsearch was not fully ready yet, other components (including Elasticsearch nodes) were trying to perform some requests/actions without success, but if it’s now working you don’t need to take care about those warning messages. All your nodes were not ready yet.
Picture #9
I love that kind of messages from Elasticsearch, Java exceptions are brilliant… Failed to execute fetch phase org.elasticsearch.transport.RemoteTransportException: [slavenode-1][10.151.0.113:9300][indices:data/read/search[phase/fetch/id]], it’s saying that it failed trying to fetch data but the target node was not available.
Picture #10
This is an important message (document_type message I meant), that you are going to see at every new version until Elasticsearch 7.0.0 is published and our integration works with that version. We are not planning to remove the document_type upto 7.0.0 but it’s in our roadmap removing al document types (alerts, monitoring, etc..)
The Restored connection message is just fine, it tells us that Logstash is connected again. Think about Logstash like a data sender who always wants to send data, it’s trying and trying because the node may be down but restored after a while.
The Detected a 6.x message is related to the document_type description that I commented above.
Best regards,
Jesús

Felipe Andres Concha Sepúlveda

To unsubscribe from this group and stop receiving emails from it, send an email to wazuh+un...@googlegroups.com.
To post to this group, send email to wa...@googlegroups.com.
Visit this group at https://groups.google.com/group/wazuh.
To view this discussion on the web visit https://groups.google.com/d/msgid/wazuh/e0a33a31-77c4-454a-8a91-abf422935dd1%40googlegroups.com.

Aneesh Dogra
To unsubscribe from this group and stop receiving emails from it, send an email to wazuh+un...@googlegroups.com.
To post to this group, send email to wa...@googlegroups.com.
Visit this group at https://groups.google.com/group/wazuh.
To view this discussion on the web visit https://groups.google.com/d/msgid/wazuh/A42A3CFE-DE0F-4CC2-9ECD-F0F1078A1278%40gmail.com.
For more options, visit https://groups.google.com/d/optout.
--
You received this message because you are subscribed to the Google Groups "Wazuh mailing list" group.
To unsubscribe from this group and stop receiving emails from it, send an email to wazuh+un...@googlegroups.com.
To post to this group, send email to wa...@googlegroups.com.
Visit this group at https://groups.google.com/group/wazuh.
To view this discussion on the web visit https://groups.google.com/d/msgid/wazuh/3ed5aa78-367a-4664-9637-8bc3235d639d%40googlegroups.com.
For more options, visit https://groups.google.com/d/optout.
--
You received this message because you are subscribed to the Google Groups "Wazuh mailing list" group.
To unsubscribe from this group and stop receiving emails from it, send an email to wazuh+un...@googlegroups.com.
To post to this group, send email to wa...@googlegroups.com.
Visit this group at https://groups.google.com/group/wazuh.
To view this discussion on the web visit https://groups.google.com/d/msgid/wazuh/e0a33a31-77c4-454a-8a91-abf422935dd1%40googlegroups.com.
For more options, visit https://groups.google.com/d/optout.
--
You received this message because you are subscribed to the Google Groups "Wazuh mailing list" group.
To unsubscribe from this group and stop receiving emails from it, send an email to wazuh+un...@googlegroups.com.
To post to this group, send email to wa...@googlegroups.com.
Visit this group at https://groups.google.com/group/wazuh.
To view this discussion on the web visit https://groups.google.com/d/msgid/wazuh/B339C419-3960-4167-8F7D-1BD7CD9ACAC9%40gmail.com.
For more options, visit https://groups.google.com/d/optout.
Aneesh
Felipe Andres Concha Sepúlveda


<PastedGraphic-16.png><PastedGraphic-16.png>
jesus.g...@wazuh.com
Hi Felipe,
I misunderstood you then. If your nodes are now working as I can see in the monitoring table I think we can check the data flow from the alerts.json file to
Elasticsearch.
List only the wazuh-alerts indices for this month as follow:
curl localhost:9200/_cat/indices/wazuh-alerts-3.x-2018.11*
Example output:
green open wazuh-alerts-3.x-2018.11.30 jYmbKP4SQXeIjxU5jVLOPg 1 0 20 0 128.8kb 128.8kb
green open wazuh-alerts-3.x-2018.11.28 KtCRB93AQXeS8HVxEPDdcA 1 0 1102 0 592.5kb 592.5kb
green open wazuh-alerts-3.x-2018.11.29 yAaM8x1HTAe-rtdaHEtZ5w 1 0 4593 0 2.1mb 2.1mb
Also, try to verify if Logstash or FIlebeat (don’t know what you are using) is reading the alerts.json file:
// SSH manager instance
lsof /var/ossec/logs/alerts/alerts.json
Also, it would be nice if you paste here the content from /etc/kibana/kibana.yml and /etc/elasticsearch/elasticsearch.yml files. Remove sensible information such as credentials
That’s all for now Felipe.
Regards,
Jesús
El viernes, 30 de noviembre de 2018, 12:30:51 (UTC+1), Felipe Andres Concha Sepúlveda escribió:
Yes there is the screen


El 30-11-2018, a las 12:24, Aneesh Dogra <liona...@gmail.com> escribió:
Have you enabled monitoring on ES? Can you share whats on that page. Thanks!
To unsubscribe from this group and stop receiving emails from it, send an email to wazuh+unsubscribe@googlegroups.com.
To post to this group, send email to wa...@googlegroups.com.
Visit this group at https://groups.google.com/group/wazuh.
To view this discussion on the web visit https://groups.google.com/d/msgid/wazuh/A42A3CFE-DE0F-4CC2-9ECD-F0F1078A1278%40gmail.com.
For more options, visit https://groups.google.com/d/optout.
--
You received this message because you are subscribed to the Google Groups "Wazuh mailing list" group.
To unsubscribe from this group and stop receiving emails from it, send an email to wazuh+unsubscribe@googlegroups.com.
To post to this group, send email to wa...@googlegroups.com.
Visit this group at https://groups.google.com/group/wazuh.
To view this discussion on the web visit https://groups.google.com/d/msgid/wazuh/3ed5aa78-367a-4664-9637-8bc3235d639d%40googlegroups.com.
For more options, visit https://groups.google.com/d/optout.
--
You received this message because you are subscribed to the Google Groups "Wazuh mailing list" group.
To unsubscribe from this group and stop receiving emails from it, send an email to wazuh+unsubscribe@googlegroups.com.
To post to this group, send email to wa...@googlegroups.com.
Visit this group at https://groups.google.com/group/wazuh.
To view this discussion on the web visit https://groups.google.com/d/msgid/wazuh/e0a33a31-77c4-454a-8a91-abf422935dd1%40googlegroups.com.
For more options, visit https://groups.google.com/d/optout.
--
You received this message because you are subscribed to the Google Groups "Wazuh mailing list" group.
To unsubscribe from this group and stop receiving emails from it, send an email to wazuh+unsubscribe@googlegroups.com.
To post to this group, send email to wa...@googlegroups.com.
Visit this group at https://groups.google.com/group/wazuh.
To view this discussion on the web visit https://groups.google.com/d/msgid/wazuh/B339C419-3960-4167-8F7D-1BD7CD9ACAC9%40gmail.com.
For more options, visit https://groups.google.com/d/optout.
Felipe Andres Concha Sepúlveda

To unsubscribe from this group and stop receiving emails from it, send an email to wazuh+un...@googlegroups.com.
To post to this group, send email to wa...@googlegroups.com.
Visit this group at https://groups.google.com/group/wazuh.
To view this discussion on the web visit https://groups.google.com/d/msgid/wazuh/cb20a70e-c5cf-45ca-8de3-1df7341cfae0%40googlegroups.com.
jesus.g...@wazuh.com
Hello again Felipe,
Please try to point your Kibana to one of your data nodes.
Currently, you have the next nodes right?
- 1 x master, no data, no ingest 10.151.0.112
- 2 x no master, data, ingest 10.151.0.113, 10.151.0.114
- 1 x Kibana pointing to 10.151.0.112
Can you try to edit /etc/kibana/kibana.yml and use one of your data nodes (.113 or .114)?
Save the file and restart Kibana. Wait about 15 seconds and try it again.
Now try this time range first on the Kibana > Discover tab:
Last 7 daysand then tryLast 1 year. I’d like to see how it works with the two filters and using a data node.
That’s not the solution but it helps me to determine what’s exactly happening.
Please, let me know how it goes once done.
Regards,
Jesús
...
Felipe Andres Concha Sepúlveda


To unsubscribe from this group and stop receiving emails from it, send an email to wazuh+un...@googlegroups.com.
To post to this group, send email to wa...@googlegroups.com.
Visit this group at https://groups.google.com/group/wazuh.
To view this discussion on the web visit https://groups.google.com/d/msgid/wazuh/bb3434d1-0d8d-4d99-853d-653768b7ef4f%40googlegroups.com.
jesus.g...@wazuh.com
Hi Felipe,
I think you have some indices without the right mapping being applied. Maybe old indices(two or three indices) are corrupting
the output from all searches.
Let’s try the next curl command (on all nodes, please):
curl elastic_ip:9200/_all/_mapping?pretty -s | grep wazuh-alerts -b2
The output should be something like this:
curl 172.16.1.2:9200/_all/_mapping?pretty -s | grep wazuh-alerts -b2
36329- }
36335- },
36340: "wazuh-alerts-3.x-2018.11.30" : {
36376- "mappings" : {
36395- "wazuh" : {
Paste the output from your three nodes here Felipe.
For your information:
/_all/_mappingthis gives us the mapping for all your indicesgrep wazuh-alerts -b2this filters the output forwazuh-alertsindices and-b2cuts the output.
Best regards,
Jesús
...
Felipe Andres Concha Sepúlveda
jesus.g...@wazuh.com
Hello again Felipe,
Ok, the numbers you are talking about are the line numbers, so don’t worry about it.
Let’s check your shards status using the next command:
curl elastic_ip:9200/_cat/shards/wazuh-alerts*
Usually, we only need to point our request to a single node but in your case, I’d like to have the output from all your nodes, please execute that command
in all your nodes, thanks.
Best regards,
Jesús
Felipe Andres Concha Sepúlveda
jesus.g...@wazuh.com
Felipe Andres Concha Sepúlveda
--
You received this message because you are subscribed to the Google Groups "Wazuh mailing list" group.
To unsubscribe from this group and stop receiving emails from it, send an email to wazuh+un...@googlegroups.com.
To post to this group, send email to wa...@googlegroups.com.
Visit this group at https://groups.google.com/group/wazuh.
To view this discussion on the web visit https://groups.google.com/d/msgid/wazuh/9214cb59-7c05-464b-980d-f106b0e75fce%40googlegroups.com.