N-mixture and occupancy
184 views
Skip to first unread message

Gabriel Brambila Milleo
Aug 8, 2022, 7:59:36 PM8/8/22
to unmarked
Hello good morning everyone, my name is Gabriel and I would like to ask everyone for help to analyze my data that was obtained during a year of collection.
I work with a population of Nasua nasua which I want to measure abundance and density.
The site was divided into 9 sites and they were covered during a year, totaling 97 sampling days.
I have data with total count of individous and also presence and absence. The sites do not have variables, would it be a naked model?
I would like to know how I can achieve the abundance of this population, as well as its density, what would be the best way?
I confess that I'm a beginner in language R!. I'm trying to follow this guide
https://jabiologo.github.io/web/tutorials/nmixture.html#n-mixture_models:_generalidades
and this other
https://jamespaterson.github.io/jamespatersonblog/2020-09-01_occupancyintroduction.html
but I'm not able to. Thank you all for your attention.
Hugs !!

aw...@scenichudson.org
Aug 10, 2022, 11:47:36 AM8/10/22
to unmarked
Hello Gabriel,
Occupancy models will not give you abundance, only the proportion of your sites where the species is present. To get abundance (density is abundance/area), you'll need to use N-mix models. I found the vignettes included with the R package very helpful when I was starting out. There are also lots of free online resources for the basics of R.
-Alex

thomas ingersoll
Aug 10, 2022, 12:04:21 PM8/10/22
to unmarked
There is an abundance-dependent occupancy model, but if you have good counts you should probably use N-mixture. Usually, the most challenging aspect is getting the data into a proper data frame: unmarked.frame. There are no covariates at all, including location and date?
My time is quite limited as I have a demanding job, but I admit to having a soft-spot for coatis. Let me know if you can't find anyone who is more available to help you with R.
Tom Ingersoll, Phd.
Mathematician
--
*** Three hierarchical modeling email lists ***
(1) unmarked (this list): for questions specific to the R package unmarked
(2) SCR: for design and Bayesian or non-bayesian analysis of spatial capture-recapture
(3) HMecology: for everything else, especially material covered in the books by Royle & Dorazio (2008), Kéry & Schaub (2012), Kéry & Royle (2016, 2021) and Schaub & Kéry (2022)
---
You received this message because you are subscribed to the Google Groups "unmarked" group.
To unsubscribe from this group and stop receiving emails from it, send an email to unmarked+u...@googlegroups.com.
To view this discussion on the web visit
https://groups.google.com/d/msgid/unmarked/5ef71552-b857-4277-b97b-b74c8e1f7a56n%40googlegroups.com*** Three hierarchical modeling email lists ***
(1) unmarked (this list): for questions specific to the R package unmarked
(2) SCR: for design and Bayesian or non-bayesian analysis of spatial capture-recapture
(3) HMecology: for everything else, especially material covered in the books by Royle & Dorazio (2008), Kéry & Schaub (2012), Kéry & Royle (2016, 2021) and Schaub & Kéry (2022)
---
You received this message because you are subscribed to the Google Groups "unmarked" group.
To unsubscribe from this group and stop receiving emails from it, send an email to unmarked+u...@googlegroups.com.
To view this discussion on the web visit
.

Javi Fernández-López
Aug 10, 2022, 5:23:51 PM8/10/22
to unma...@googlegroups.com
Hi Gabriel,
I'm the writer of the "jabiologo" N-mix tutorial you mentioned so you can reach me at jflop...@gmail.com with any doubts. Hope it was useful!
Best,
Javi
--
*** Three hierarchical modeling email lists ***
(1) unmarked (this list): for questions specific to the R package unmarked
(2) SCR: for design and Bayesian or non-bayesian analysis of spatial capture-recapture
(3) HMecology: for everything else, especially material covered in the books by Royle & Dorazio (2008), Kéry & Schaub (2012), Kéry & Royle (2016, 2021) and Schaub & Kéry (2022)
---
You received this message because you are subscribed to the Google Groups "unmarked" group.
To unsubscribe from this group and stop receiving emails from it, send an email to unmarked+u...@googlegroups.com.
To view this discussion on the web visit https://groups.google.com/d/msgid/unmarked/999c15e4-ca09-4ef0-a292-6eaf5cac40bbn%40googlegroups.com.
Gabriel Brambila Milleo
Aug 11, 2022, 7:51:09 AM8/11/22
to unmarked
Hi, thanks for replying, I would like to update you about my case and also ask for help to interpret.
It follows the images of the results obtained in relation to occupancy and detectability.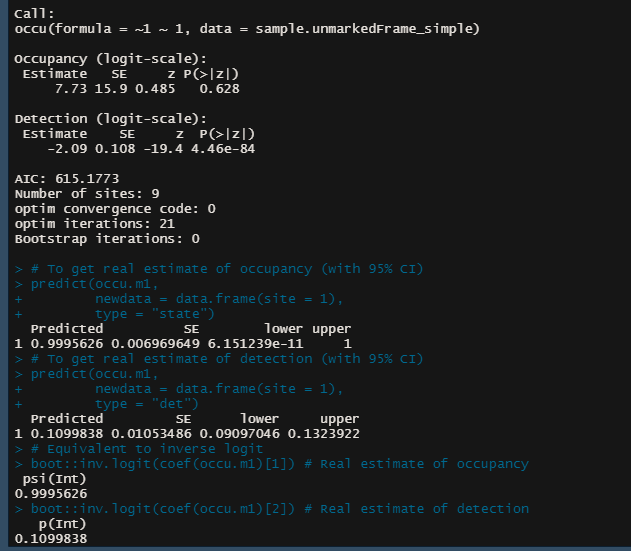
It follows the images of the results obtained in relation to occupancy and detectability.

gcsadoti
Aug 12, 2022, 9:04:51 AM8/12/22
to unmarked
This states the estimated probability of occupancy is very close to 1 in your study area (i.e., all sites occupied) and that the probability of detection on a given survey is close to 0.11 (i.e., species detected about 11% of the time given presence).

Marc Kery
Aug 16, 2022, 5:53:03 AM8/16/22
to unma...@googlegroups.com
Hi Javi,
I just quickly skimmed your tutorial and was delighted to see this material in your wonderful language. Hope it makes these methods more widely accessible in South America and even Spain.
Good luck and best regards -- Marc
To view this discussion on the web visit https://groups.google.com/d/msgid/unmarked/CAKqN%2Bi2Xt67uYS5uj_okhLzLUVJ24GtbA45bu%3Dgj-Z5%3DAzGcUw%40mail.gmail.com.
Reply all
Reply to author
Forward
0 new messages