Global Coupling induces Regime switching in the Generic2DOscillator and its underlying interpretation
44 views
Skip to first unread message

Borjan Milinkovic
Sep 19, 2022, 11:30:57 AM9/19/22
to TVB Users
Hi all,
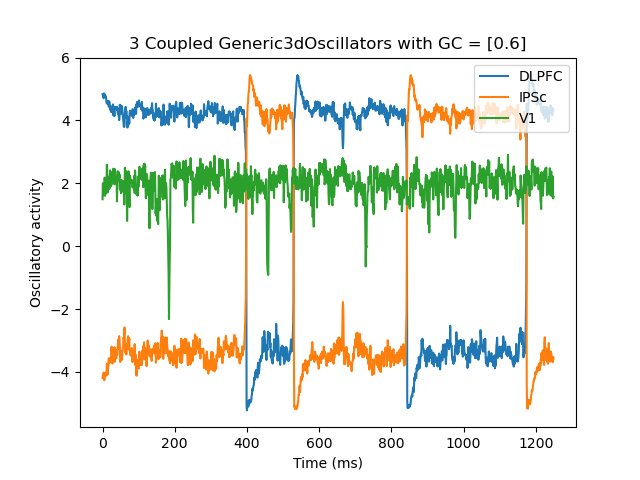
I have been simulating three coupled Generic2D Oscillator nodes, with no temporal delay. The structural matrix only couples 2 of the nodes while 1 remains uncoupled from both of them. I have consequently used Knock et al. and Ghosh et al. parameters for the local dynamics of each node that should simulate alpha (~12Hz) frequency activity at each local node. I then varied the Global Coupling parameter from 0.0 to 0.9 by 0.1 intervals.
What I am finding is that after a particular GC factor (~0.2) the dynamics seem to 'switch regimes' and I don't know how to interpret this. Nor how to define this limitation.
Also, is there any way I can interpret the value of the oscillatory model? Do the values give me any meaning, or is there any difference between the values of the time-series being -4 or 4?
I have attached an image of the simulated oscillatory activity for a candidate GC value. Just a note that x-axis is incorrectly labelled, they are time points of sampling not the actual time in milliseconds.
Any help on this would be much appreciated.
Thanks in advance,
Borjan

WOODMAN Michael
Sep 20, 2022, 3:39:53 AM9/20/22
to TVB Users
hi
From the plotted signals, it doesn't appear to be oscillating, I'd guess the coupling is too strong, so the nodes are sitting at fixed points, but because of the noise, the two coupled nodes exchange fixed points (this is easier to understand
with a phase plane plot).
I'd suggest lowering the coupling strength significantly, using logarithmic sweep instead of linear, e.g. 10**np.r_[-5:-1:32j]
This oscillator model is phenomenological, you shouldn't try to interpret its activity in terms of physiological units. The Wilson-Cowan & Jansen-Rit models would be more appropriate if you need that sort of thing.
cheers,
Marmaduke
--
You received this message because you are subscribed to the Google Groups "TVB Users" group.
To unsubscribe from this group and stop receiving emails from it, send an email to tvb-users+...@googlegroups.com.
To view this discussion on the web visit https://groups.google.com/d/msgid/tvb-users/62f770c7-6bca-45dd-b718-96f073f1c47cn%40googlegroups.com.
<oscPlot_06.png>
Borjan Milinkovic
Sep 20, 2022, 4:17:52 AM9/20/22
to TVB Users
Hi Marmaduke,
Thanks for your advice. I'll try a logarithmic sweep of the coupling parameter.
Is there a way I can plot the phase plane of two coupled oscillators using TVB?
I tend to see oscillatory signals that are dampened by the coupling and masked with the additive noise, but still present around the fixed points of -4, and 4 (limit cycles around the given points) at a low amplitude.
Like you mention, it would be useful to plot these two coupled oscillators on a phase plane, so if that is possible at all with TVB that would be great! I now only know how to plot a single neural mass model on a phase plane.
Regarding interpretation: I'm aware it is a phenomenological model, but can the units be interpreted as anything, or should one not try to interpret this at all. i.e. is there anything to be said if our oscillations are centred around -2 or 5, for example? Should one then just z-score these, as they only represent the value of the fixed point, or centring of the limit cycle.
Again, thanks so much for your help.
Best,
Borjan
WOODMAN Michael
Sep 20, 2022, 7:31:34 AM9/20/22
to TVB Users
hi,
On 20 Sep 2022, at 10:17, Borjan Milinkovic <borjan.m...@gmail.com> wrote:
Is there a way I can plot the phase plane of two coupled oscillators using TVB?
There's a phase plane tool in the GUI
I tend to see oscillatory signals that are dampened by the coupling and masked with the additive noise, but still present around the fixed points of -4, and 4 (limit cycles around the given points) at a low amplitude.Like you mention, it would be useful to plot these two coupled oscillators on a phase plane, so if that is possible at all with TVB that would be great! I now only know how to plot a single neural mass model on a phase plane.
You can't visualize all four dimensions of a two 2D oscillator system on a phase plane, without slicing the phase space in some way which will make it difficult to interpret visually.
Regarding interpretation: I'm aware it is a phenomenological model, but can the units be interpreted as anything, or should one not try to interpret this at all. i.e. is there anything to be said if our oscillations are centred around -2 or 5, for example? Should one then just z-score these, as they only represent the value of the fixed point, or centring of the limit cycle.
You should only z-score if they fluctuate around a fixed point, otherwise the z-scoring is not meaningful: if they are in the limit cycle regime or switching between fixed points, then it's not normally distributed.
cheers,
Marmaduke
Borjan Milinkovic
Sep 20, 2022, 7:45:26 AM9/20/22
to tvb-...@googlegroups.com
Thanks again Marmaduke!
I have used the phase plane and the interactive through jupyter to visualise my local dynamics. But alternatively was seeing if there was some utility to model multiple nodes (with maybe just the V variable in TVB). But what you say makes sense - and yes the interpretability issue with modelling two nodes in one phase space was what I was wondering about: if maybe TVB had a set feature for specific neural mass models where this was possible.
Though that' s okay, I have managed to figure out some of my "anti-phase" switching between values.
The intention with my simulations is to model 10Hz with noise to represent neural activity. Performing a power spectra one should generate 1/f-like dist. with high power in the 10-12 Hz range. And, given the additive noise, could one assume normally distributed, or stationary time-series for i.e: connectivity analyses, if the limit cycle regime (our oscillations) is around a particular value? I'm guessing here what would be important is that the noise is substantial enough to assume normality?
Cheers,
Borjan
--
You received this message because you are subscribed to a topic in the Google Groups "TVB Users" group.
To unsubscribe from this topic, visit https://groups.google.com/d/topic/tvb-users/C2w5SjxW5kM/unsubscribe.
To unsubscribe from this group and all its topics, send an email to tvb-users+...@googlegroups.com.
To view this discussion on the web visit https://groups.google.com/d/msgid/tvb-users/CF415630-C963-41B8-9616-13D890229690%40univ-amu.fr.
Borjan Milinkovic
Sep 20, 2022, 7:59:53 AM9/20/22
to TVB Users
To add to this,
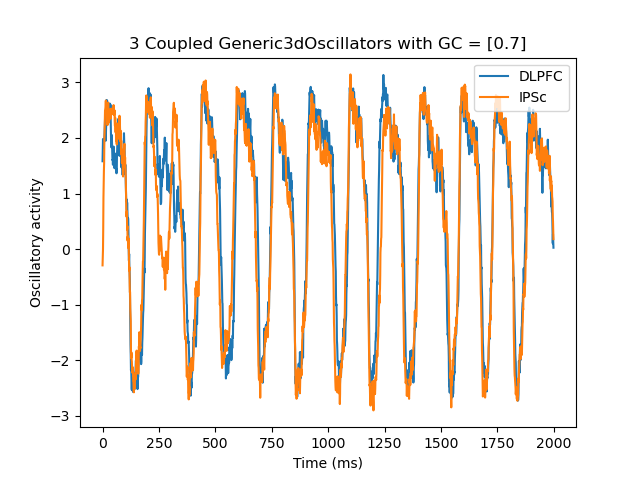
I perform an Augmented Dickey-Fuller Test to test stationarity of each of my univariate time-series and I obtain p-values = ~0.000005: rejecting the null hypothesis. This is for all of my simulations given they are oscillating (with noise.Additive = 0.01) around a particular point and not switching fixed points such as the above image. So stationarity can be assumed.
The below image is a representation of the time-series. Ideally I will look to sweep over the noise parameter as well to test this assumption, as well as it's effect on directed connectivity estimates.
Borjan
WOODMAN Michael
Sep 20, 2022, 8:07:38 AM9/20/22
to TVB Users
hi
I'd suggest to start with smaller values of coupling and noise, since this sort of oscillatory regime is high coupling and high noise. Note the oscillator itself has an excitability parameter (`a` I think) which can be tuned as well. In the
3 parameter space, there will be a curved surface representing the transition from fixed point to limit cycle, measured by increased global variance. This is the sort of thing you should find first, by parameter exploration, in order to calibrate, then you
can move in the right direction to find the target spectra you mention.
cheers,
Marmaduke
You received this message because you are subscribed to the Google Groups "TVB Users" group.
To unsubscribe from this group and stop receiving emails from it, send an email to tvb-users+...@googlegroups.com.
To view this discussion on the web visit https://groups.google.com/d/msgid/tvb-users/cecdabb7-0cb5-4aa9-8de9-3134d1588889n%40googlegroups.com.
<oscPlot_07.png>
Borjan Milinkovic
Sep 29, 2022, 9:24:02 AM9/29/22
to TVB Users
Thanks for the great advice Marmaduke. I implemented a logarithmic parameter sweep between some tweaked values and it seems useful. I'm also aware of the the influence of the excitatory parameter at the local node dynamics, and have set that to varying between what qualitatively appeared to be a queiscent period, a period verging on oscillations and an oscillatory period.
You hint towards creating a 3D space of three parameters (global_coupling, noise, and local.coupling.a) and to identify a surface using the global variance measure in TVB.
I think this idea is very productive and would be interested to see if you have any example code that I could then adapt to my simulation?
And, I presume I could then demonstrate visually within which parameter regime we are able to see alpha oscillations?
Thanks kindly for all your help!
Best,
Borjan
WOODMAN Michael
Sep 29, 2022, 10:01:46 AM9/29/22
to tvb-...@googlegroups.com
hi,
I don't have any example code for this, but it should be straightfoward: setup a grid in 3 dimensions, evaluate one or more metrics on a simulation for each point in the grid, and then use a contour plot from VTK or similar to visualize the surfaces.
cheers,
Marmaduke
From: tvb-...@googlegroups.com <tvb-...@googlegroups.com> on behalf of Borjan Milinkovic <borjan.m...@gmail.com>
Sent: Thursday, September 29, 2022 3:24:02 PM
To: TVB Users
Subject: [SUSPECTED SPAM] Re: [RESEAUX SOCIAUX] [TVB] Global Coupling induces Regime switching in the Generic2DOscillator and its underlying interpretation
Sent: Thursday, September 29, 2022 3:24:02 PM
To: TVB Users
Subject: [SUSPECTED SPAM] Re: [RESEAUX SOCIAUX] [TVB] Global Coupling induces Regime switching in the Generic2DOscillator and its underlying interpretation
To view this discussion on the web visit
https://groups.google.com/d/msgid/tvb-users/bbf63334-7b1b-4d49-b76d-acd6cedc4c03n%40googlegroups.com.
Borjan Milinkovic
Sep 29, 2022, 10:10:48 AM9/29/22
to tvb-...@googlegroups.com
Ah, this is nice. Yes, very do-able.
I think I could plot this with an information-theoretic metric I'm testing on this data as well, and not just global variance or frequency spectra. Thanks for the tip!
Cheers,
B.
To view this discussion on the web visit https://groups.google.com/d/msgid/tvb-users/f77d5fbc1a71476181e362935eca1911%40univ-amu.fr.
Reply all
Reply to author
Forward
0 new messages