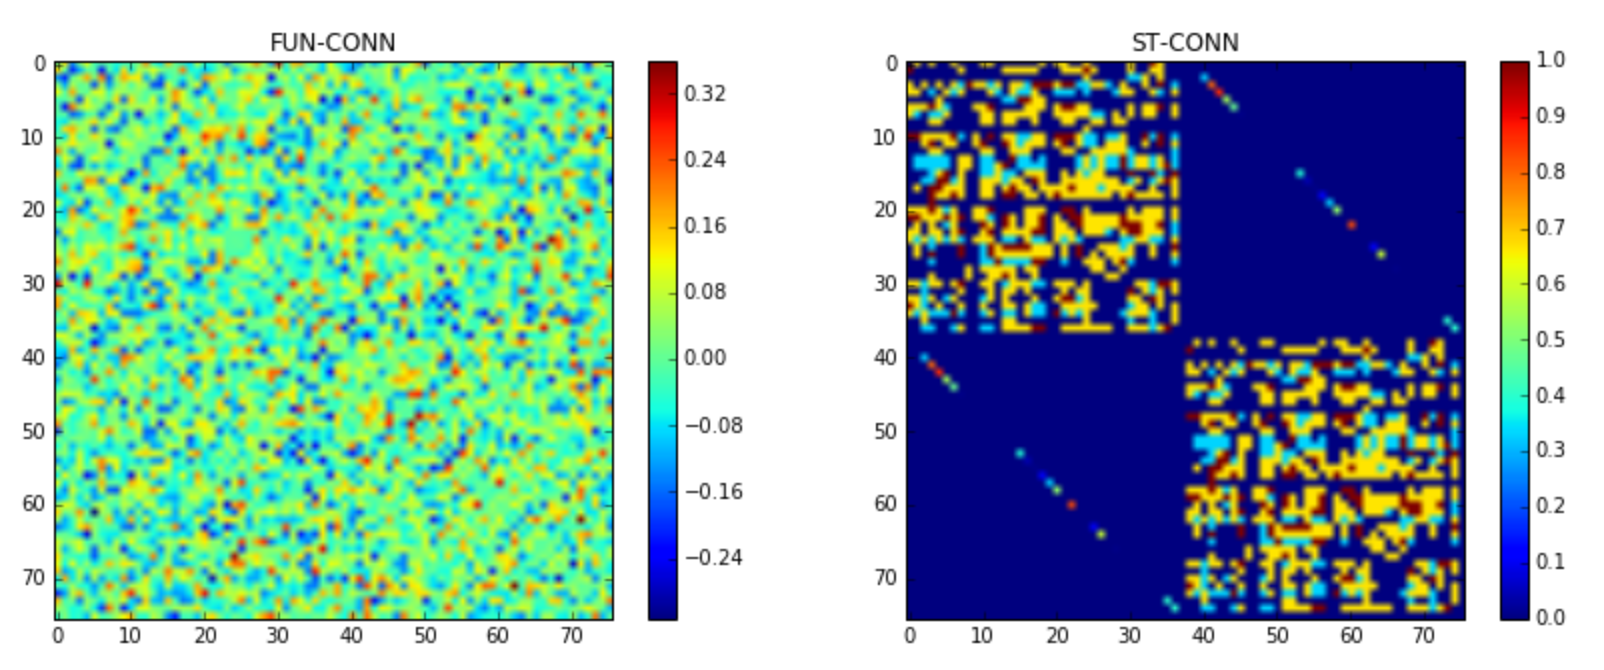
surprisingly low correlation between SC and FC after simulations

raymon X
conn.weights = conn.scaled_weights(mode='tract')
model=model,
connectivity=conn,
coupling=coupling.Linear(a=numpy.array([6e-2])),
simulation_length=5e4,
integrator=integrators.HeunStochastic(
dt=2 ** -4,
noise=noise.Additive(nsig=numpy.array([0.001]))),
monitors=(
monitors.TemporalAverage(period=1.0),
monitors.Bold(period=500.0)
)
)
sim.configure()

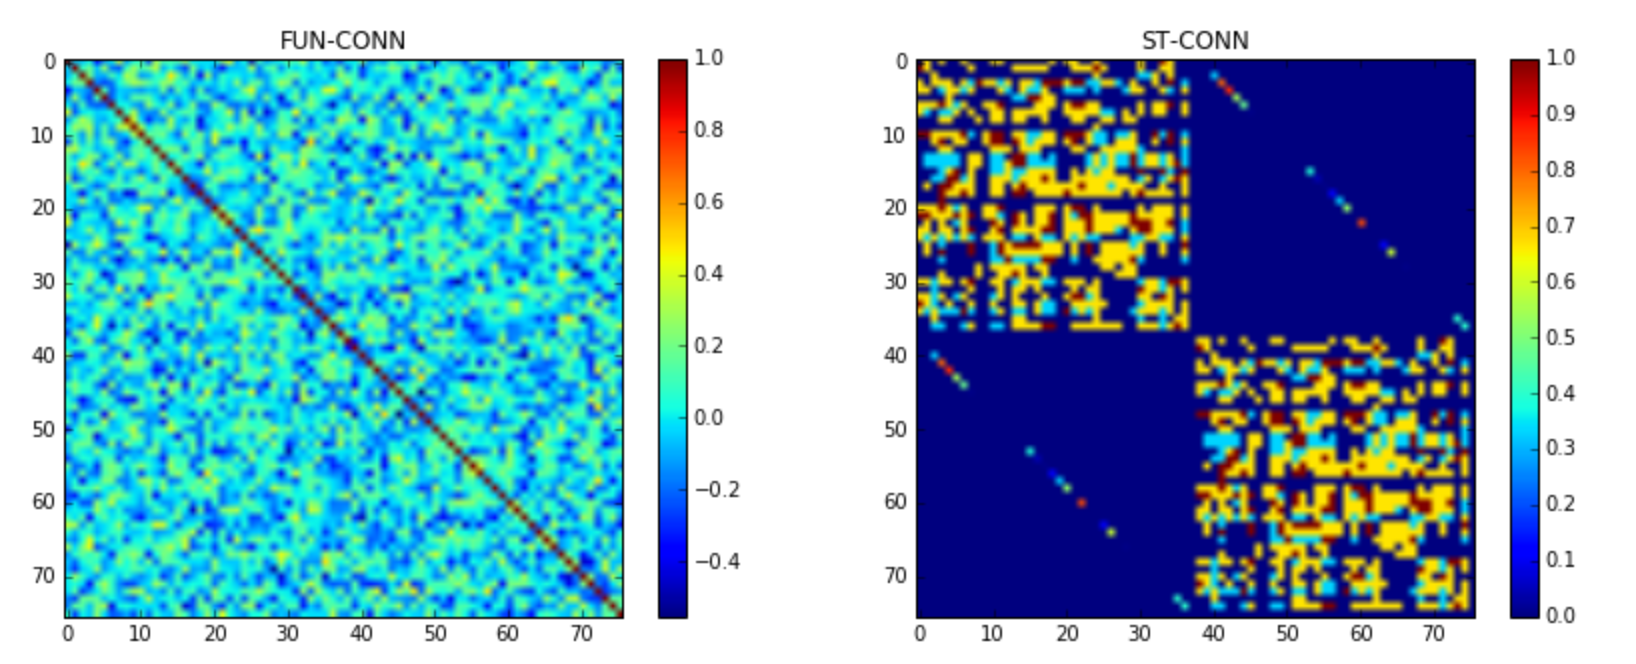
I was a bit surprise to see that functional connectivity is so different than structural connectivity plot and it looks so random... Why is that the case? Am I doing something wrong here?
I expected to see more network-like structure on the left handside of above plot. I tried various values of linear coupling (high 0.1 and low 1e-4) and every time I get similar plot.

Julie Courtiol
--
You received this message because you are subscribed to the Google Groups "TVB Users" group.
To unsubscribe from this group and stop receiving emails from it, send an email to tvb-users+...@googlegroups.com.
To view this discussion on the web visit https://groups.google.com/d/msgid/tvb-users/149611cb-4ba1-4d49-b144-cdd140d65bc6o%40googlegroups.com.

raym...@gmail.com
model=model,
connectivity=conn,
simulation_length=3e5,
integrator=integrators.HeunStochastic(
dt=2 ** -2,
noise=noise.Additive(nsig=numpy.array([0.0001]))),
monitors=(
monitors.Bold(period=500.0),
monitors.ProgressLogger(period=5e3)
)
)
sim.configure()
Julie Courtiol
>> sim.initial_conditions = (0.001)*np.ones((1, 1, nregions, 1))

To view this discussion on the web visit https://groups.google.com/d/msgid/tvb-users/4a01b8b0-43a3-4ba9-99e1-28f822ac2dacn%40googlegroups.com.

WOODMAN Michael
hi
There is a lot of fine print in these papers, beyond initial conditions. For example, there is frequently an averaged connectome being used, which boosts the results strongly. The FC correlations are being z scored, etc. All of these have to been applied
in order to make a proper comparison.
By contrast, the default connectome in TVB is a tracer study, and it does not produce high correlations as easily as this paper makes it look. This is neither positive or negative: they are just different data and methods, and what one should focus on is
the sensitivity of this empirical-simulated FC relation with respect to your parameters of interest.
cheers,
Marmaduke Woodman,
TVB Engineer, INS AMU; +33
4 91 32 42 38 +33 7 67 77 84 72
Sent: Wednesday, August 26, 2020 5:47:04 PM
To: tvb-...@googlegroups.com
Subject: Re: [TVB] surprisingly low correlation between SC and FC after simulations

John Griffiths
raym...@gmail.com
raym...@gmail.com

JIAQI ZHANG
Julie Courtiol
Le 3 oct. 2021 à 17:25, JIAQI ZHANG <smile.z...@gmail.com> a écrit :
Hi! I'm new to TVB and I have a really easy question. How can I decide which parameter is the critical point and get the value of critical point of different models in TVB?
To view this discussion on the web visit https://groups.google.com/d/msgid/tvb-users/89c04e63-834e-490e-836e-65a974874ed2n%40googlegroups.com.