Google Charts in TiddlyWiki
241 views
Skip to first unread message

andrewg_oz
Jul 2, 2022, 5:51:52 AM7/2/22
to TiddlyWiki
I recently needed some way to get a line graph in one of my TiddlyWikis. I found a plugin, but it didn't do a very good job. I thought it might be possible to use Google Charts, but I had no idea how I might go about doing that.
A bit of searching located this post from last year:
This works, but has a lot of hard-coded stuff. I wanted something more flexible.
Using that post as the starting point, I've come up with a single macro that uses separate tiddlers to hold the chart data. I have an example TiddlyWiki on my Dropbox:
All the magic is in the "GoogleChart" macro.
You can quickly see the demo charts, but it will need to be downloaded to see 'behind the scenes'.
I got this far mostly by trying random tiddlywiki syntax until things worked. I'm not familiar with macros at all. I'd welcome any feedback on how I've done things.
Apart from that - do whatever you like with it!
Cheers,
Andrew

springer
Jul 3, 2022, 12:05:03 PM7/3/22
to TiddlyWiki
Andrew,
This is quite beautiful! I haven't tried to work with it, but I can imagine many uses for such graphs. Thanks for taking the time to set up a sample site with so many examples!
If you have a tiddlyhost account, might you post a version there, so that this thread can offer a pointer that doesn't require a download? (Your wording suggests you expected the graphs could be "quickly seen" without downloading, but the dropbox link just yields the html file.)
-Springer
andrewg_oz
Jul 9, 2022, 3:22:54 AM7/9/22
to TiddlyWiki
Hi Springer,
Dropbox was working, but it was because I was logged in. Logging out just shows code for me too. I shouldn't have been so lazy to not use my own hosting (it's just been a while since I used it):
Now with more examples of selection handling and data transclusion!

arun babu
Jul 15, 2022, 5:03:03 PM7/15/22
to TiddlyWiki
Hi Andrew,
This looks interesting. Is there a way to extract the tiddler field values for charts instead of manually typing the data .
Thanks,
Arun

Charlie Veniot
Jul 16, 2022, 2:58:59 PM7/16/22
to TiddlyWiki
G'day Arun,

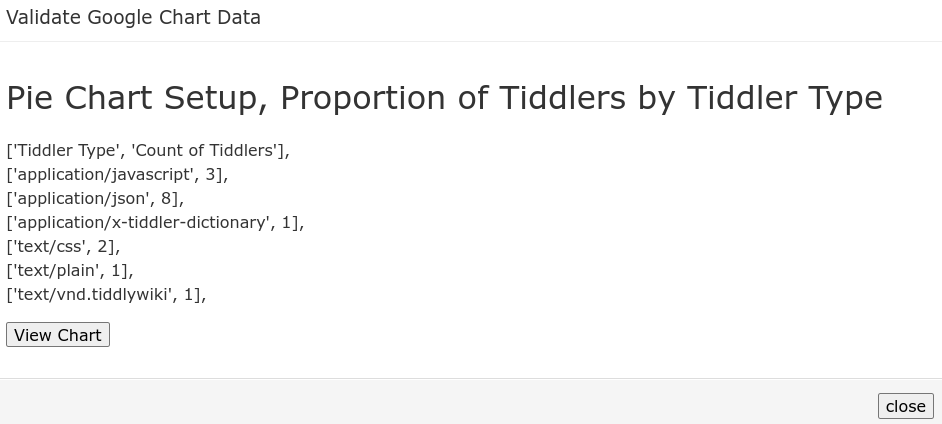
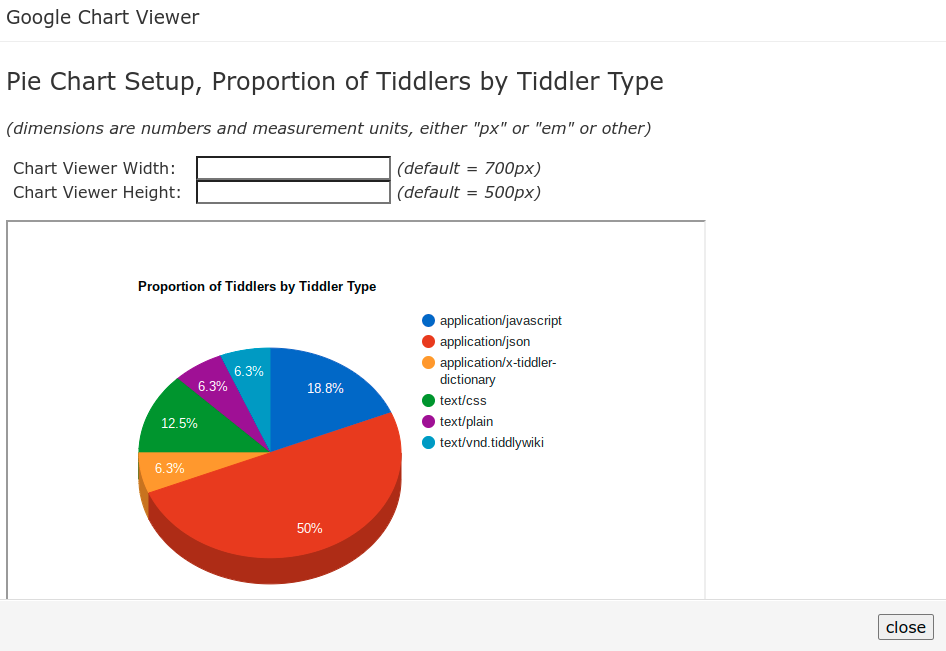
I have not looked at how Andrew has set things up, but I did look at the data source for his pie chart.
You should be able to do something similar to what I have done with my project (i.e. provide a data tiddler that dynamically puts together the data), a bit like in these screenshots from my project:
arun babu
Jul 16, 2022, 5:06:38 PM7/16/22
to TiddlyWiki
Thanks Charlie. I need a similar chart for my budget wiki. Will ask for your help, once I have a solid idea about the implementation.
Charlie Veniot
Jul 16, 2022, 5:28:16 PM7/16/22
to TiddlyWiki
Well, Andrew has taken my initial prototype (related discussion linked in Andrew's OP) further along.
He's done some good stuff there, but organized differently than the direction I was heading.
I'll make suggestions as best I can, but some could require changes/additions Andrew or somebody else needs to make.
andrewg_oz
Jul 17, 2022, 12:53:50 PM7/17/22
to TiddlyWiki
I've just uploaded some updates for a couple of things:
1. There is a parser that can render tiddlers containing the JavaScript data arrays like WikiText tables. Just a cosmetic thing.
2. I've made the macro support data tables entered as WikiText tables. This breaks when fancy JavaScript things are required, but is good for simple data.
My goals for this project were two-fold:
1. An embedded system I've been developing produces data viewable using the Timeline chart type and I wanted to include examples of that chart in my TiddlyWiki that is documenting the project.
2. For my own amusement I wanted to plot a line chart of my firmware size over time.
3. Since developing my macro I've been considering creating a Timeline chart of firmware releases with clickable items going to the corresponding release notes that are already in the TiddlyWiki.
It seems that some people are wanting to dynamically analyse their TiddlyWiki and visualise aspects of it? I don't know if this helps, but the following worked to have data produced in a macro:
\define test()
['Year','Sales','Expenses'],['2004',1000,400],['2005',1170,460],['2006',660,1120],['2007',1030,540],
\end
<<googlechart data:'<<test>>' title:'Company Data' chart:'AreaChart' options:"hAxis:{title:'Year',titleTextStyle:{color:'#333'}},vAxis:{XminValue:0}">>
['Year','Sales','Expenses'],['2004',1000,400],['2005',1170,460],['2006',660,1120],['2007',1030,540],
\end
<<googlechart data:'<<test>>' title:'Company Data' chart:'AreaChart' options:"hAxis:{title:'Year',titleTextStyle:{color:'#333'}},vAxis:{XminValue:0}">>
And if the tiddler has a field called "chartdata" with the value "['Year','Sales','Expenses'],['2004',1000,400],['2005',1170,460],['2006',660,1120],['2007',1030,540],", then the following also works:
<<googlechart data:{{!!chartdata}} title:'Company Data' chart:'AreaChart' options:"hAxis:{title:'Year',titleTextStyle:{color:'#333'}},vAxis:{XminValue:0}">>
Cheers,
Andrew
springer
Jul 17, 2022, 1:28:04 PM7/17/22
to TiddlyWiki
Alas, I'm getting a red error box on load:

arun babu
Jul 17, 2022, 1:42:57 PM7/17/22
to tiddl...@googlegroups.com
Hi Springer
That's because of some incompatibility between Krystal and multicolumn plug in...I have set up this wiki just for demo purpose - each demo I have made into a seperate story using ensemble feature of multicolumn plug in (which include the use of Krystal along with multicolumn plug in) - each demo can be accessed via the topbar or ensemble tiddler. You can just ignore the error message for the time being. I have raised a GitHub issue regarding this in Krystal GitHub repo. But the creator haven't responded yet. Error message will disappear if Krystal plug in is disabled.
Arun
--
You received this message because you are subscribed to a topic in the Google Groups "TiddlyWiki" group.
To unsubscribe from this topic, visit https://groups.google.com/d/topic/tiddlywiki/YcGCVLNZLEk/unsubscribe.
To unsubscribe from this group and all its topics, send an email to tiddlywiki+...@googlegroups.com.
To view this discussion on the web visit https://groups.google.com/d/msgid/tiddlywiki/f2f0ac86-02a3-4b4f-9cae-55745d470521n%40googlegroups.com.
andrewg_oz
Jul 17, 2022, 11:43:23 PM7/17/22
to TiddlyWiki
I've just uploaded an updated wiki. No further changes to the macro or parser, but a couple of new demo tiddlers under the renamed "Advanced Examples" tab:
"Data In Field": where the data is stored in a tiddler field
"Macro Generated Data": where the data is generated by a macro (a pie chart of how many of my examples are 'basic' and how many are 'advanced')
Cheers,
Andrew
Reply all
Reply to author
Forward
0 new messages