Presenting: GRAPHS - pies, bars, scatter and whatever turns you on
680 views
Skip to first unread message

Mat
Jul 25, 2017, 9:26:25 AM7/25/17
to TiddlyWiki, Jeremy Ruston
Directly from the guys at TWaddler Neuro Blast Enterprises...
....extremely proudly to presenting...
[beta]
I'll be abroad for a few days now so will probably not be
able to communicate much, but please do come with input.
<:-)

Mat
Jul 25, 2017, 11:06:22 AM7/25/17
to TiddlyWiki
Thanks Josiah, fixed.
<:-)

Jeremy Ruston
Jul 25, 2017, 11:10:17 AM7/25/17
to Mat, TiddlyWiki
Hi Mat
Bravo! That’s pretty brilliant. The presentation is excellent: lots of copious documentation and examples. But the way that you’ve been able to generate all the graphs just using existing TiddlyWiki primitives is very impressive, and a testimony to your ingenuity.
Best wishes
Jeremy
@TiddlyTweeter
Jul 26, 2017, 3:43:07 PM7/26/17
to TiddlyWiki
Ciao Mat
This looks awesome. I'm beginning to play with it. I can see its relevance to quite a lot of what I'm doing.
I'll comment properly later.
Meanwhile, I notice a layout issue on both Firefox and Chrome ...
And on Firefox only ...
Best wishes
Josiah
This looks awesome. I'm beginning to play with it. I can see its relevance to quite a lot of what I'm doing.
I'll comment properly later.
Meanwhile, I notice a layout issue on both Firefox and Chrome ...
And on Firefox only ...
Best wishes
Josiah

Danielo Rodríguez
Jul 28, 2017, 8:40:12 AM7/28/17
to TiddlyWiki
I'm experiencing similar issues on my mobile.
Great plugin despite that
Mat
Jul 28, 2017, 1:34:16 PM7/28/17
to tiddl...@googlegroups.com
Thanks for the kind words, guys!
I made some updates. Please report any other things that look wrong.
Updated
- line graph should spread properly in table
- the prettylist demo
- chronology macro/stylesheet should now not go outside the tiddler
<:-)
Mat
Aug 4, 2017, 5:29:36 PM8/4/17
to TiddlyWiki
Updates made. (still beta)
Several (probably not noticeable) tweaks have been. The only major feature change is:
Three "special fields" have been introduced, to easily (1)indent the graph, (2)add a header or (3)a footer. These are probably such common use cases that I wanted to enable them without CSS knowledge.
@Pit.W - The Gantt macro is approaching readiness - but not quite there yet.
@Thomas E - I intend to experiment replacing the current calc macro with your rpn solution, hoping for more efficiency thanks to your wikification of the output. Also, I note the rpn randomization feature which will enable a fun idea I have... :-)
Input is more than welcome.
<:-)
@TiddlyTweeter
Aug 4, 2017, 6:10:12 PM8/4/17
to TiddlyWiki
As far as I see it reads data from TiddlerS. I think there are lot of occasions where reading data from ONE Data Dictionary would be Just As Good.
Take the case of doing a search of the novel Great Expectations for the word occurrence of Biddy, Pip, Miss Havisham, Estella, Wemmick, Jaggers, Joe, Herbert & Orlick. you won't find those counts in any tiddler. Rather, they pertain to thousands of paragraphs.
The case would be this kind of outcome in a Data Dictionary:
Wemmick: 107
Pip: 302
Estella: 135
Orlick: 28
Herbert: 98
Jaggers: 72
Joe: 123
Miss Havisham: 102
Biddy: 57
Can your gizmo sail with this easy kind of data counts? Or even make Word Clouds of them?
Best wishes,
Josiah
Mat
Aug 4, 2017, 6:42:51 PM8/4/17
to TiddlyWiki
@TiddlyTweeter wrote:
As far as I see it reads data from TiddlerS. I think there are lot of occasions where reading data from ONE Data Dictionary would be Just As Good.
Hm, interesting - I misunderstood you at first: I think it should be possible to use one dictionary (or rather, its entries) as input for the graph, instead of tiddlers. That's a very good idea.
...but you seem to want something else: Using one single text as input and somehow count occurrences of predefined strings, right? The graph macro is rather kind of the step after; you give it the value you want to visualize. How to get the number to begin with is a totally different matter.
That said, someone made a word count widget (Thomas?). I would think it should be tweakable to count specific strings rather than (I assume) space characters. You could then use a regular list widget and with your funny names as the filter argument and apply the count widget/macro on one name at a time to get the desired list.
Or even make Word Clouds of them?
(What the heck!? ;-) Word clouds is exactly the thing I had in mind when I tried to be mysteriously cryptic in what I would to with the randomization feature in Thomas' rpn macro. I have actually already experimented with this a bit, for the Graphs macro, and I'm pretty close to a cool solution but need a better randomizer than what I currently have.
<:-)
@TiddlyTweeter
Aug 4, 2017, 7:01:55 PM8/4/17
to TiddlyWiki
Mat wrote:
@TiddlyTweeter wrote:As far as I see it reads data from TiddlerS. I think there are lot of occasions where reading data from ONE Data Dictionary would be Just As Good.Hm, interesting - I misunderstood you at first: I think it should be possible to use one dictionary (or rather, its entries) as input for the graph, instead of tiddlers. That's a very good idea....but you seem to want something else: Using one single text as input and somehow count occurrences of predefined strings, right?
NO. I'd have the dictionary done already. Not your issue. It would be this ...
Label: count
The basic structure of Data Dictionaries is that. It would need be ALREADY ready. Data dictionaries could be anything. The one thing they are NOT, usually, is dynamic data.
Josiah, x

Alex Hough
Aug 5, 2017, 2:34:12 AM8/5/17
to TiddlyWiki
Matt,
you've been busy!
Wow!
Alex
--
You received this message because you are subscribed to the Google Groups "TiddlyWiki" group.
To unsubscribe from this group and stop receiving emails from it, send an email to tiddlywiki+unsubscribe@googlegroups.com.
To post to this group, send email to tiddl...@googlegroups.com.
Visit this group at https://groups.google.com/group/tiddlywiki.
To view this discussion on the web visit https://groups.google.com/d/msgid/tiddlywiki/aa8daf62-c5e2-430c-b9e0-bf4ef7200711%40googlegroups.com.
Danielo Rodríguez
Aug 5, 2017, 7:29:45 AM8/5/17
to TiddlyWiki, jeremy...@gmail.com
This is what I see on my phone:

Danielo Rodríguez
Aug 5, 2017, 7:32:36 AM8/5/17
to TiddlyWiki
Can you see my screenshot?
Now that I checked the example on landscape mode I saw the "for you" message, so that "error" may be intentional ?
Mat
Aug 5, 2017, 5:38:47 PM8/5/17
to TiddlyWiki
Danielo Rodríguez wrote:
Can you see my screenshot?Now that I checked the example on landscape mode I saw the "for you" message, so that "error" may be intentional ?
Ah, yes, that is in deed intentional - and it is especially made just for the demo. Bad idea of mine to demo it with something that can appear like an error. I do want to show that it's possible to single out slices but "serving" it above or below doesn't feel aesthetically right, so I'll do some thinking.
Thanks for pointing it out.
<:-)
Mat
Aug 8, 2017, 5:31:51 PM8/8/17
to TiddlyWiki
Update (still beta)
Main change is not noticeable but the previous calculation plugin has been exchanged for fellow @Thomas Elmigers rpn plugin! (Thank you Thomas!) It simplified the code in a few places thanks to the "built in" wikification of the result and I'm doing some experiments with its randomization feature.
Hopefully fellow Danielo will also be happy with the Pie demo now. The special slice serving should hopefully show up better on small screens.
Thanks to everyone for the kind words.
<:-)

Thomas Elmiger
Aug 10, 2017, 9:05:03 AM8/10/17
to TiddlyWiki
Hi Mat
Great to hear that my rpn plugin is of use to others!
Your remaining problem with chart slices >50% reminds me of a similar problem you had with CircleBar … please feel free to steal back from my variant on https://tid.li/tw5/styles.html in case you want to integrate something similar in Graphs!
Happy graphing,
Thomas
Mat
Aug 10, 2017, 11:36:33 AM8/10/17
to TiddlyWiki
Thomas Elmiger wrote:
Your remaining problem with chart slices >50% reminds me of a similar problem you had with CircleBar … please feel free to steal back from my variant on https://tid.li/tw5/styles.html in case you want to integrate something similar in Graphs!
I had totally forgotten about that. Thanks! I'll see what I can do.
<:-)

codacoder...@outlook.com
Aug 10, 2017, 12:24:40 PM8/10/17
to TiddlyWiki
I forgot about this little gem! Especially HashStr -- excellent solution to the problem of having to supply/think of IDs per use. I'm using HashStr already :)

Stephen Kimmel
Aug 14, 2017, 5:20:57 PM8/14/17
to TiddlyWiki, jeremy...@gmail.com
Probably I am just exceptionally dense, but I'm having problems with this.
I imported everything listed on the install tiddler, and for good measure everything tagged demo, demoData, sample and sample2. Demp Pie gives me two large colored circles. Demo Line gives me graph axis but no graph. Demo Mapper gives me the text but no graphs. etc. etc. etc. It looks to me as though there is some critical tiddlers that weren't included in the ones mentioned on the install tiddler, but I can't figure out which ones they are.
So... What am I missing here?
Mat
Aug 14, 2017, 8:36:58 PM8/14/17
to TiddlyWiki
Stephen, I'll investigate this tomorrow.
<:-)
Mat
Aug 15, 2017, 11:44:24 AM8/15/17
to TiddlyWiki
Update
- Likert scales
- Added a missing tag that caused the problems identified by Stephen (Thank you Stephen!!!)
- Updated to latest rpn, i.e the "basic math calculations" macro by Thomas Elmiger (Big thanks Thomas!!!)
- Pies can now handle >50%. Thanks (again) go to Thomas even if I ended up using another, more contextual, method to achieve it.
(Unfortunately, my >50% solution sacrificed the pretty box-shading that gave the pie a 3d look. Not crucial, but still. I'll probably make future attempts to get it back but it is not prioritized.)
Do keep ideas / opinions on Graphs coming.
Note that "graphs" is not limited to show... well, graphs; The "engine" just visually presents numerical (or other) data from a list of tiddlers, where the data set can be treated as a whole or at the individual level. If you have any "related" tiddlers, graphs might be of use to present them. For example, I'd think(!) one could use it to illustrate
- Board games, such as chess
- Perhaps make exploded views of things, where each thing is a tiddler
- ...more ideas?
<:-)
Stephen Kimmel
Aug 15, 2017, 12:00:48 PM8/15/17
to TiddlyWiki, jeremy...@gmail.com
That, pretty much, takes care of my issue. Now I'm off and running toward looking at it.
Not to be real picky about this... but I noticed that on the install sheet you added likert but lost line. And for what it is worth, x-axis and y-axis are also required to get the Demo-Line to work properly. You might consider adding the x-axis and y-axis items to the Line tag as well.
Stephen
Not to be real picky about this... but I noticed that on the install sheet you added likert but lost line. And for what it is worth, x-axis and y-axis are also required to get the Demo-Line to work properly. You might consider adding the x-axis and y-axis items to the Line tag as well.
Stephen
Mat
Aug 17, 2017, 3:23:10 PM8/17/17
to TiddlyWiki
Update
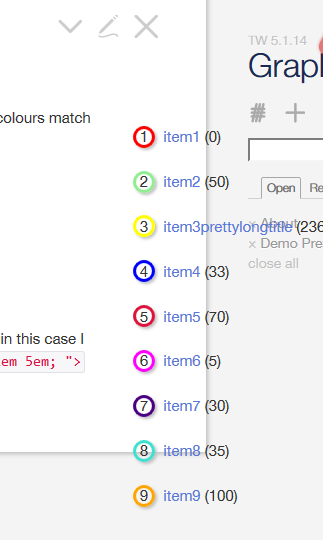
The installation procedure has been much simplified to now serve one complete graph per plugin. See image.
...actually, the blue pills are not plugins but instead "draggable lists" kind of like tagpills. (Thanks Stef!)
While Graphs is still in beta, I did some cleaning in the process so earlier versions may not be fully compatible. To clean out earlier versions, use some batch deletion to delete everything tagged "graphs".
<:-)

Dave Parker
Jun 30, 2020, 4:54:52 PM6/30/20
to TiddlyWiki
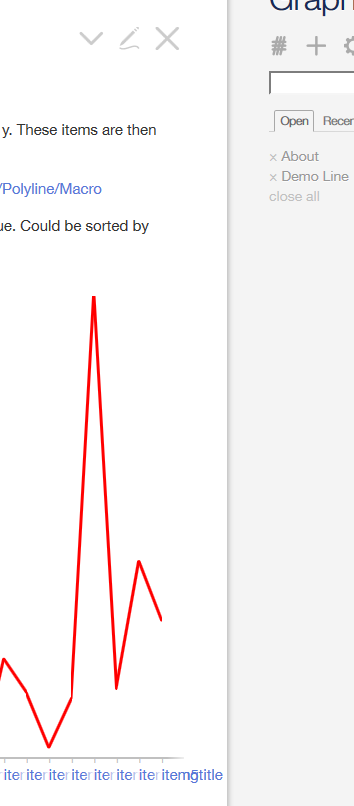
Is there a way to get a line graph with super simple input like this:
so ultimately this to produce a graph:
<<graph "13 7 19 15" line>>
I tried that on your site, but it doesn't render anything
Ultimately I want to input a string of values generated by a list widget like this:
<$list filter="[<currentTiddler>addsuffix[.VAShi]fields[]regexp[\d\d\d\d-\d\d-\d\d]]" variable="field"><$text text={{{ =[<currentTiddler>addsuffix[.VAShi]get<field>] =[<currentTiddler>addsuffix[.VASlo]get<field>] =[<currentTiddler>addsuffix[.disAbil]get<field>] +[sum[]] }}}/></$list><<graph "{{||vasSumGraph}}" line>>
But obviously I'm not grasping something about how the plugin works.

TW Tones
Jun 30, 2020, 9:19:10 PM6/30/20
to TiddlyWiki
Dave,
Can I suggest in future posting a new topic even if you provide the link to the old thread.
There is a danger the old thread you raised from the dead has being superseded, and your reactivating the old one will cause problems.
Thanks
Tony
Dave Parker
Jun 30, 2020, 10:36:45 PM6/30/20
to TiddlyWiki
Will do, thanks Tony
Mat
Jul 1, 2020, 4:24:17 AM7/1/20
to TiddlyWiki
Dave, I agree with Tony, but to your issue:
Is there a way to get a line graph with super simple input like this:
No, the list is assumed to consist of tiddlers where their "y" field values are the numbers.
Overall: Note that sinde Graphs was created, TW has introduced "math operatos" and also the CSS language has improved (e.g conic gradients are now possible) so Graphs is much due for an update.
<:-)
Reply all
Reply to author
Forward
0 new messages