phenotype data for GWAS
211 views
Skip to first unread message

Ruijuan li
Sep 17, 2015, 3:19:47 PM9/17/15
to TASSEL - Trait Analysis by Association, Evolution and Linkage
Dear all,
I am working on a project to find the SNPs associated with nematode resistance of cotton. Now I have the genotype data from GBS, I also have the original phenotype data (nematode count relative to susceptible control). Different results (i.e. significant associated SNPs) were generated if I use the original phenotype data and rank-based transformed data (e.g. 1-10 rated as 1, 11-30 rated as 2, 31-60 rated as 3, and >60 rated as 4). Attached are the two Manhattan plots I got with two forms of phenotype data: 1 got from original phenotype data, 2 from rank-based transformed data.
My question is which phenotype data format get more reliable result from GWAS? the original phenotype data or the rank-based transformed data? should I validate the result by using R?


Edward S. Buckler
Sep 17, 2015, 5:05:08 PM9/17/15
to tas...@googlegroups.com
Most of the statistic assume normally distributed data. I would assume that you have some outliers and small datasets. I would transform data and/or evaluate the outliers.
Cheers-
Ed
--
You received this message because you are subscribed to the Google Groups "TASSEL - Trait Analysis by Association, Evolution and Linkage" group.
To unsubscribe from this group and stop receiving emails from it, send an email to tassel+un...@googlegroups.com.
To post to this group, send email to tas...@googlegroups.com.
To view this discussion on the web visit https://groups.google.com/d/msgid/tassel/5e2bcf0e-b49a-4f14-8bc8-5f0068483899%40googlegroups.com.
For more options, visit https://groups.google.com/d/optout.
Ruijuan li
Sep 17, 2015, 5:59:27 PM9/17/15
to TASSEL - Trait Analysis by Association, Evolution and Linkage
Dr. Buckler,
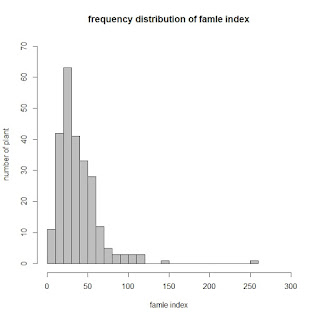
I used a filtered set of over 8,000 SNPs for 249 samples with phenotype data (thought this is a reasonable sample size). I understand to transform my data to get a normal distribution, but how to evaluate the outliner? Below is the frequency distribution of my original phenotype data.
On Thursday, September 17, 2015 at 4:05:08 PM UTC-5, Edward Buckler wrote:
Most of the statistic assume normally distributed data. I would assume that you have some outliers and small datasets. I would transform data and/or evaluate the outliers.
Cheers-Ed
On Sep 17, 2015, at 3:19 PM, Ruijuan li <rzl...@gmail.com> wrote:
Dear all,
I am working on a project to find the SNPs associated with nematode resistance of cotton. Now I have the genotype data from GBS, I also have the original phenotype data (nematode count relative to susceptible control). Different results (i.e. significant associated SNPs) were generated if I use the original phenotype data and rank-based transformed data (e.g. 1-10 rated as 1, 11-30 rated as 2, 31-60 rated as 3, and >60 rated as 4). Attached are the two Manhattan plots I got with two forms of phenotype data: 1 got from original phenotype data, 2 from rank-based transformed data.
My question is which phenotype data format get more reliable result from GWAS? the original phenotype data or the rank-based transformed data? should I validate the result by using R?
--
You received this message because you are subscribed to the Google Groups "TASSEL - Trait Analysis by Association, Evolution and Linkage" group.
To unsubscribe from this group and stop receiving emails from it, send an email to tassel+un...@googlegroups.com.
To post to this group, send email to ta...@googlegroups.com.
Reply all
Reply to author
Forward
0 new messages