How to avoid double plot evaluation?
176 views
Skip to first unread message

mattek
Jan 4, 2017, 11:29:13 AM1/4/17
to Shiny - Web Framework for R
In the following code I generate a random vector upon button press and plot a histogram. I have two numericInput fields to enter lower and upper bounds for data clipping. The values of these fields are set based on the generated data. The problem is that once I hit the button, the plot is drawn twice, which I'd like to avoid. I made this redrawing easier to see by adding Sys.sleep(2).
Here's the flow of the app:
Also, double plotting occurs after hitting reset button with both numericInput fields modified.
library(shiny)
ui <- shinyUI(fluidPage(  titlePanel("test data clipping"),    sidebarLayout(    sidebarPanel(      actionButton('inDataGen', 'Generate dataset'),      br(),      br(),      uiOutput('resetable_input_clip'),      actionButton('inDataClipReset', 'Reset data clipping')    ),    mainPanel(plotOutput("plotHist", width = "100%"))  )))
server <- shinyServer(function(input, output, session) {  rValues <- reactiveValues(dataIn = NULL,                            dataClip = NULL,                            dataMin = -10e10,                            dataMax = -10e10)      # generate random dataset  observeEvent(input$inDataGen, {    cat(file = stderr(), '\nuserDataGen\n')        # assign result to shared 'dataIn' variable    x <- rnorm(1000)    rValues$dataIn = x    rValues$dataMin = min(x)    rValues$dataMax = max(x)  })   # clip data from below  observeEvent(input$inDataClipMin, {    cat(file = stderr(), 'dataMod:min\n')        dm = rValues$dataClip    thresh = input$inDataClipMin
      if (!is.null(dm))      {        cat(file = stderr(), 'dataMod:min:clip\n')        dm[dm < thresh] <- thresh        rValues$dataClip <- dm      }        })
  # clip data from above  observeEvent(input$inDataClipMax, {    cat(file = stderr(), 'dataMod:max\n')        dm = rValues$dataClip    thresh = input$inDataClipMax        if (!is.null(dm))    {      cat(file = stderr(), 'dataMod:max:clip\n')      dm[dm > thresh] <- thresh      rValues$dataClip <- dm    }        })    output$resetable_input_clip <- renderUI({    cat(file = stderr(), 'output$resetable_input_clip\n')        times <- input$inDataClipReset    rValues$dataClip = rValues$dataIn        div(      id = letters[(times %% length(letters)) + 1],      numericInput(        'inDataClipMin',        'Clip data below threshold:',        value = rValues$dataMin,        width = 200,        step = .1      ),      numericInput(        'inDataClipMax',        'Clip data above threshold:',        value = rValues$dataMax,        width = 200,        step = .1      )    )  })    output$plotHist <- renderPlot({    cat(file = stderr(), 'plotHist \n')        dm = rValues$dataClip        if (is.null(dm))      return(NULL)    else {      plot(hist(dm))      Sys.sleep(2)    }  })})
shinyApp(ui = ui, server = server)
Here's the flow of the app:
# App started
output$resetable_input_clipplotHist dataMod:mindataMod:max
userDataGen # generate data button pressedoutput$resetable_input_clipplotHist # 1st drawing of the plotdataMod:mindataMod:min:clipdataMod:maxdataMod:max:clipplotHist # 2nd drawing
jeremiah rounds
Jan 4, 2017, 6:39:40 PM1/4/17
to mattek, Shiny - Web Framework for R
Liberal use of shiny::isolate({})
Try this put everything after input$inDataClipReset into
isolate({
})
--
You received this message because you are subscribed to the Google Groups "Shiny - Web Framework for R" group.
To unsubscribe from this group and stop receiving emails from it, send an email to shiny-discuss+unsubscribe@googlegroups.com.
To view this discussion on the web visit https://groups.google.com/d/msgid/shiny-discuss/3c435a73-89a7-4a1e-b77b-e151f23f1fbe%40googlegroups.com.
For more options, visit https://groups.google.com/d/optout.
mattek
Jan 4, 2017, 6:52:34 PM1/4/17
to Shiny - Web Framework for R, macd...@gmail.com
Tried isolate but then plot doesn't appear at all when I press Generate dataset button.
To unsubscribe from this group and stop receiving emails from it, send an email to shiny-discus...@googlegroups.com.
jeremiah rounds
Jan 4, 2017, 7:07:05 PM1/4/17
to mattek, Shiny - Web Framework for R
Might be hacky but you can put rValues$re_initialize_plot = runif(1) at the bottom of inDataGen and then put read it before the isolate in inDataClipReset. It will basically link that logic to follow the inDataGen logic in a reactive chain.
To unsubscribe from this group and stop receiving emails from it, send an email to shiny-discuss+unsubscribe@googlegroups.com.
To view this discussion on the web visit https://groups.google.com/d/msgid/shiny-discuss/b8030687-455e-4958-bbdb-47658eb794f0%40googlegroups.com.
![Joe Cheng [RStudio]'s profile photo](http://lh3.googleusercontent.com/a-/ALV-UjVqfaUaTd2_krhrbdVriEUodBRGVOSlt2Sxl6CiqFo76WU9xb8y=s40-c)
Joe Cheng [RStudio]
Jan 5, 2017, 1:20:13 AM1/5/17
to Shiny - Web Framework for R
Improved version: https://gist.github.com/jcheng5/3499a8201b8cb98b4593c8bce9fc6737
The fundamental issue is over-reliance on observeEvent + reactiveValues to do calculations. This isn't a complicated app, but it's already complicated enough that you can see how hairy it is trying to trace through all of these side effects. Calculations are designed to be done with reactive(), you should stay away from observeEvent + reactiveValues if you can. I highly recommend watching the talks I gave on "Effective Reactive Programming" here: https://www.rstudio.com/resources/webinars/shiny-developer-conference/
Once I refactored your app to use reactives, the problem still didn't go away, but it became tractable. Try removing the two lines with "freezeReactiveValue" to see the state I was in. In this case we get double rendering because when the Generate button is clicked, these things happen:
1. input$inDataGen changes, causing dataIn (and dataClip and the plot) to invalidate.
2. observeEvent(dataIn(), { ... }) fires, causing resetClip to be called; this doesn't immediately update the min/max inputs though, see below.
3. The renderPlot runs.
4. Reactivity finishes, the new plot is flushed to the browser, along with the message that min/max inputs should be updated to new values.
5. The browser renders the plot and updates the min/max inputs.
6. The min/max inputs have changed so that causes new values to be sent to R.
7. input$inDataClipMin/Max update, causing dataClip (and the plot) to invalidate.
8. The renderPlot runs.
9. Reactivity finishes, the new plot is flushed to the browser.
So basically step 3 is the lost work we're trying to avoid. What is the fundamental problem here? It's that we know input$inDataClipMin/Max are about to change but they haven't changed yet, so any calculations/visualizations that involve them are inherently going to become worthless instantly. So anytime you have:
- reactive X changes, and that causes both updateInput(Y) and output Z to run
and
- output Z also depends on input Y
then you'll end up with this double-rendering problem.
freezeReactiveValue is our solution to that problem. You call it right next to (before or after doesn't matter) your call to updateNumericInput or whatever. It puts the specified input value in a state where any attempt to read them, will result in discarding the current calculation. (Technically, req(FALSE) is called.) The input value automatically "thaws" when the current round of reactivity is done executing.
The upshot is that step 3 still executes, but it terminates early (as soon as one of the frozen inputs is read). I moved the plotHist log line to below the call to dataClip() so you could see this.
I know this is all pretty esoteric. We have debated making updateNumericInput automatically call freezeReactiveValue, but that would likely break existing apps that have solved the same problem in other ways (worse ways, but unavoidable before we had freezeReactiveValue). In the meantime, this mechanism may be obscure and hard to explain, but once you know what to look for it's straightforward to reason about.
(The above refers to updateNumericInput because that's what I used, but the same applies when you use renderUI to regenerate inputs with new values, as you did in your sample code.)
I hope this helps.
mattek
Jan 5, 2017, 5:46:01 AM1/5/17
to Shiny - Web Framework for R
Thank you for this amazing insightful answer! This does solve my problem.
When I was using observeEvent + reactiveValues it did feel like I was doing the wrong thing but version I had with reactive() was also ending up with double evaluation. Anyway, I'll be sure to watch your talks!

Stephen McDaniel
Jan 5, 2017, 8:53:35 AM1/5/17
to mattek, Shiny - Web Framework for R
Hi Mattek,
Joe answered your original question. So that should help you understand the nuances of reactive programming relative to your app.
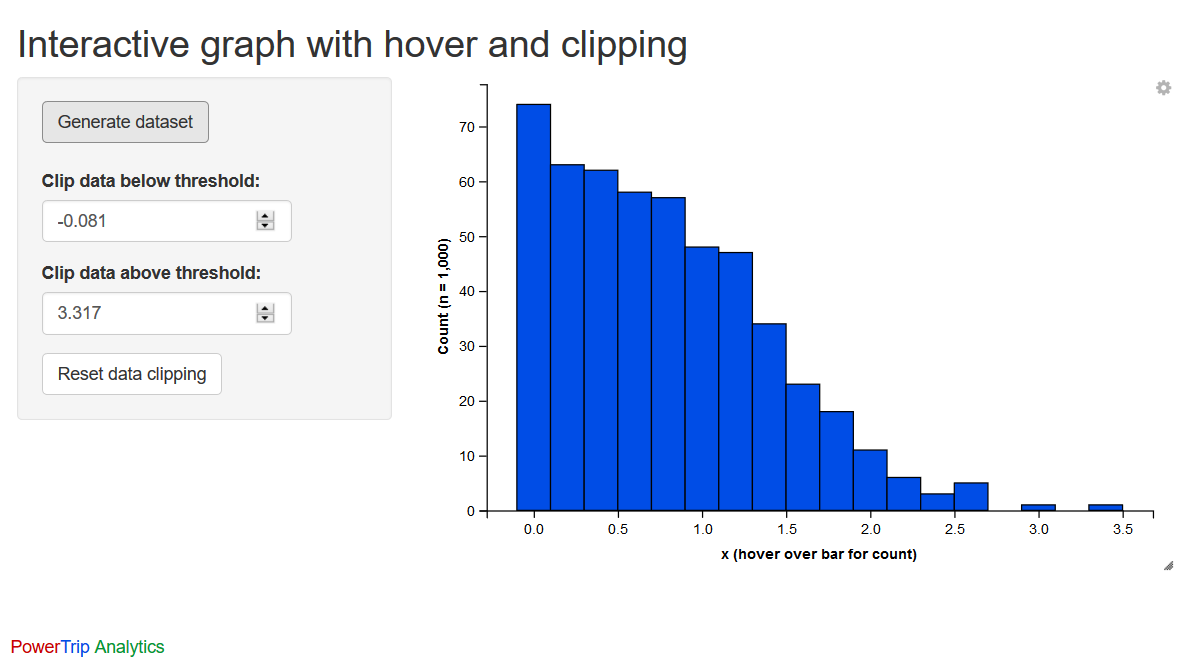
I wanted to streamline your example and expand upon it by adding input error checking, an interactive Vega/D3 type histogram with a hover tooltip and a few other improvements.
I spent additional time on this as it could be a good template understanding a random data and the normal distribution in a stats course. Of course, it can easily be adapted to other distributions and could even be adapted for a file upload, etc.
See https://github.com/Stephen-McDaniel/shiny-managing-inputs-reset-error-check-ggvis-historgram Joe answered your original question. So that should help you understand the nuances of reactive programming relative to your app.
I wanted to streamline your example and expand upon it by adding input error checking, an interactive Vega/D3 type histogram with a hover tooltip and a few other improvements.
I spent additional time on this as it could be a good template understanding a random data and the normal distribution in a stats course. Of course, it can easily be adapted to other distributions and could even be adapted for a file upload, etc.
Best regards,
Stephen McDaniel
Stephen McDaniel
Chief Data Scientist
Automatic data, analytic & visualization solutions in the cloud
--
You received this message because you are subscribed to the Google Groups "Shiny - Web Framework for R" group.
To unsubscribe from this group and stop receiving emails from it, send an email to shiny-discuss+unsubscribe@googlegroups.com.
To view this discussion on the web visit https://groups.google.com/d/msgid/shiny-discuss/e24eb9ed-fc7e-453a-b183-5111332b89ab%40googlegroups.com.
--
Best regards,
Stephen McDaniel
Stephen McDaniel
Chief Data Scientist
Automatic data, analytic & visualization solutions in the cloud
mattek
Jan 9, 2017, 5:47:28 AM1/9/17
to Shiny - Web Framework for R, macd...@gmail.com, Stephen....@gmail.com
Hi Steven,
Looks good!
I'm myself building an app for a publication. It's using various clustering algorithms to process a specific dataset but I guess it could be useful to explore clustering in general. It's available here:
One thing I was wondering about after this thread is the problem I posted as a separate question here: https://groups.google.com/d/msg/shiny-discuss/9yG7hPMT5Qc/Ujdh6L87FQAJ
Joe mentioned to avoid reactiveValues but I'm struggling to avoid it in a case where I'm plotting data that can be generated by two different methods, i.e. loaded from a file or generated within the app. If you had a chance, I'd appreciate any tips with regard to that problem I posted above.
To unsubscribe from this group and stop receiving emails from it, send an email to shiny-discus...@googlegroups.com.
To view this discussion on the web visit https://groups.google.com/d/msgid/shiny-discuss/e24eb9ed-fc7e-453a-b183-5111332b89ab%40googlegroups.com.
Stephen McDaniel
Jan 9, 2017, 3:04:11 PM1/9/17
to mattek, Shiny - Web Framework for R
Hi Mattek,
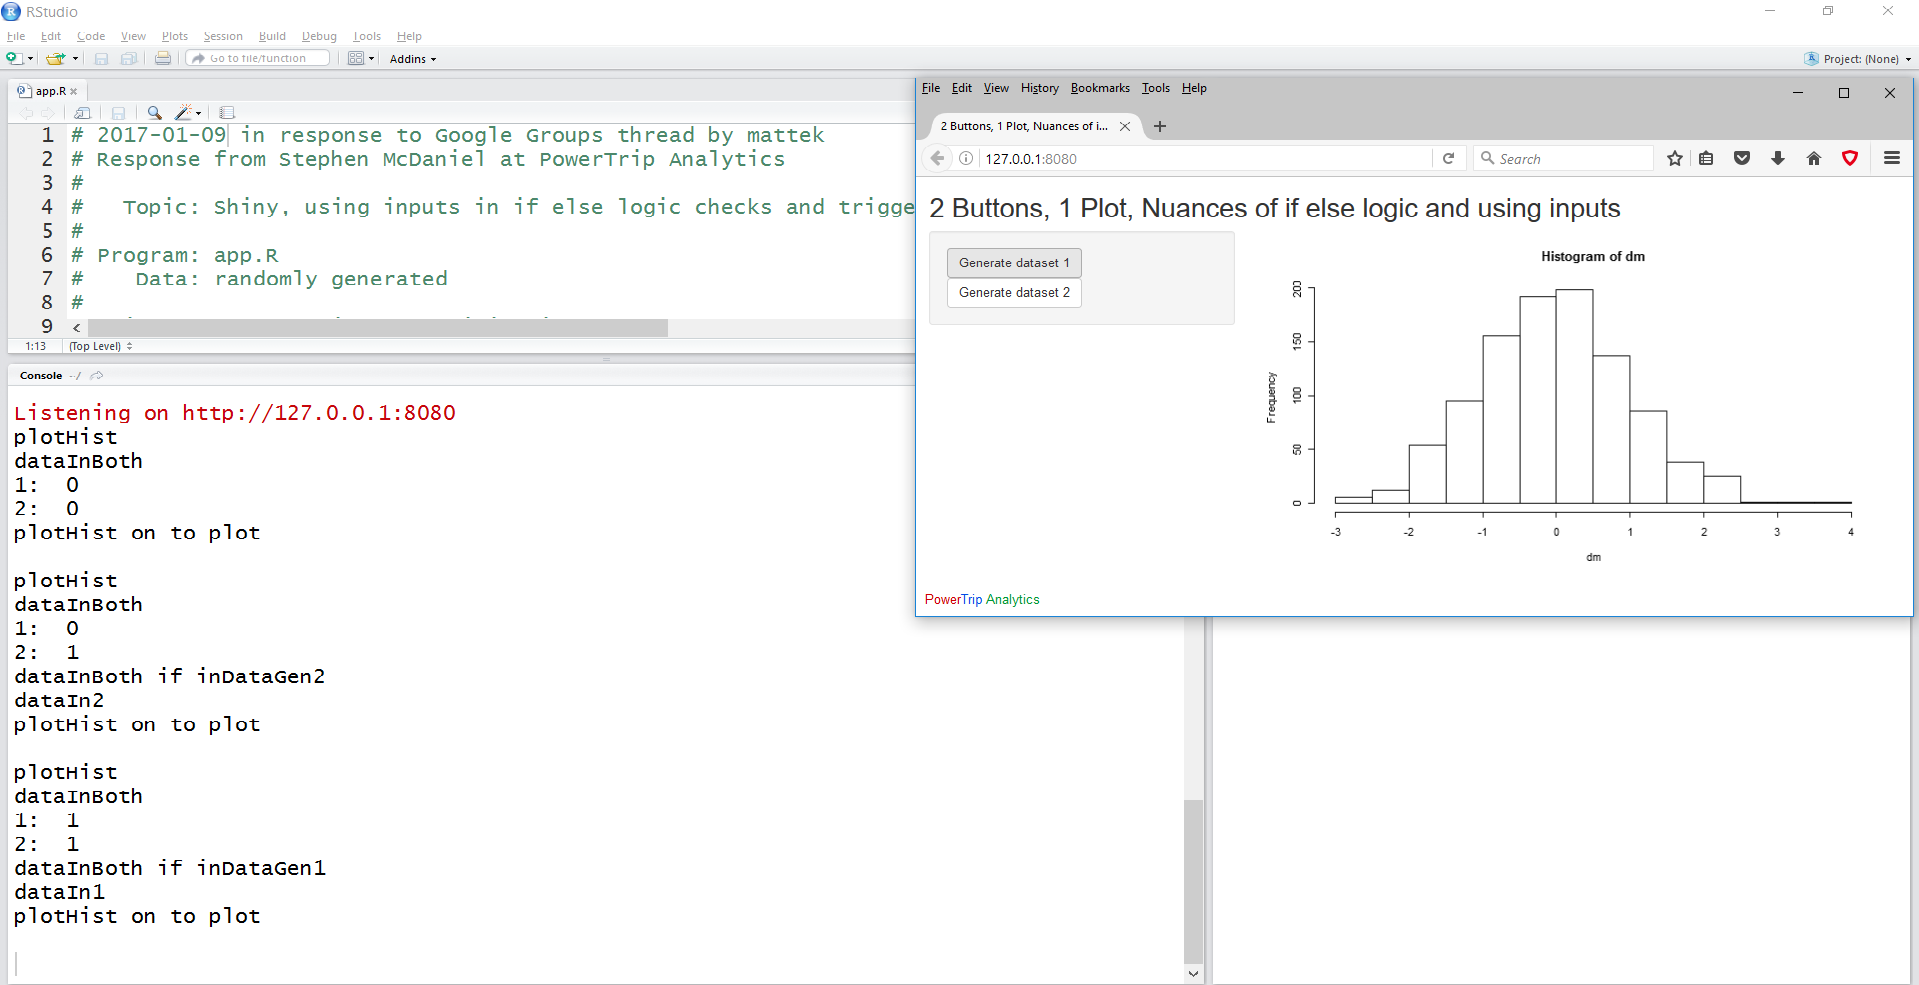
Here is a solution to that conundrum: https://github.com/Stephen-McDaniel/reactives-used-if-else-logic-shiny
I use a reactive values list object to track usage of the action buttons and determine which data to utilize.
Also, I find it very useful to trace reactive flows in the console with cat statements. I have added them to illustrate this example.Here is a solution to that conundrum: https://github.com/Stephen-McDaniel/reactives-used-if-else-logic-shiny
I use a reactive values list object to track usage of the action buttons and determine which data to utilize.
mattek
Jan 9, 2017, 4:46:03 PM1/9/17
to Shiny - Web Framework for R, macd...@gmail.com, Stephen....@gmail.com
Thanks a million, again! Even though it makes total sense, I must admit it's not the most intuitive way, at least for me.
When you say "use direct retrieval of inputs...", do you mean lines like these before if statement in dataInBoth (given cat statement is commented out):
locInGen1 = input$inDataGen1 locInGen2 = input$inDataGen2And then use them in if statement? It works for me, but I want to make sure I'm not missing something ;)
As a general solution to the situation where you have two sources of data and a plot, would you say this is the code? Or would you attack it completely differently?
Stephen
Jan 9, 2017, 4:55:20 PM1/9/17
to mattek, Shiny - Web Framework for R
I would say a better general solution is an observe that watches multiple inputs/reactives and explicitly assigns a reactive value to trigger specific actions. Almost a central router with all input requests going in and simplified reactive value structures going out. As applications grow very complex, this central management code has been a easier to manage solution in my experience.
For your example, my solution is good enough. Yes to the explicit assignment if called in complex if else logic, as you noted is good. I personally like cat() like calls of them myself for sanity checks and future debugging. There may be better solutions, but this makes it essy for me to think through problems and share with my teams.
Best regards,
Stephen McDaniel
Stephen McDaniel
Chief Data Scientist
PowerTrip Analytics
Automatic data, analytic & visualization solutions in the cloud.
Sent from my iPhone, please excuse typos or absurd word "corrections"
Joe Cheng
Jan 9, 2017, 5:02:39 PM1/9/17
to Stephen, mattek, Shiny - Web Framework for R
Stephen, great thoughts and I would love to discuss the implications in your solution a step or two further, but it is the week of rstudio::conf and I have a lot to do. I hope to post a follow up on this thread in a couple of weeks.
(If you happen to be attending rstudio::conf please come find me and introduce yourself!)
(If you happen to be attending rstudio::conf please come find me and introduce yourself!)
To view this discussion on the web visit https://groups.google.com/d/msgid/shiny-discuss/D0AE0CD0-385B-4BDF-9E06-7F780E300B2D%40gmail.com.

Lukas Lundström
Jan 13, 2017, 8:25:03 AM1/13/17
to Shiny - Web Framework for R, stephen....@gmail.com, macd...@gmail.com
I've noticing that I spend a big part of my shiny programming time trying so solve issues related to reactivity, especially as apps grows complex.
Stephen, I found your "central router" solutions interesting. In your solutions, would you keep track of changes in inputs with reactiveValues (as in your example above) and have your "router" (an observe()) do some logic on that and then explicitly fire off some action by invalidating a reactiveValue$trigger that is placed in some downstream calculation like eventReactive(reactiveValue$trigger, { do calc })?
I've a reactive trigger construct (based on code from http://www.mango-solutions.com/wp/2016/12/dynamically-generated-shiny-ui) that I have been using for the purpose of getting more explicit action handling. See further down for code. I can do stuff like calc1 <- eventReactive(calcTrigger$depend(), {do some calc}), and invalidate the calc1() reactive by calling calcTrigger$trigger() within some upstream observer logic holding track of inputs and/or other reactives (like Stephens "central router" solution)
I can also delay it with calcTrigger$delayedTrigger(500), which invalidates calc1() after >500 ms. If I call calcTrigger$delayedTrigger(500) again before it has been invalidated, the invalidation is postponed 500 ms again. This allows me to put less effort into designing the reactive flow as every call to calcTrigger$delayedTrigger() ensures that the dependent calculations will be invalidated but also that they are invalidated only once (within a time range). I created it to solve exactly this problem with two invalidations when calling updateNumericInput (I was not aware of the freezeReactiveValue)
Not sure if this is good solutions though. For example slow internet connection could lead to unnecessary invalidations if the delay time is set too strict. And freezeReactiveValue solves the double invalidation problem without introducing delaying (delaying can give a more responsive interaction tough, if plotting is time consuming).
Regards,
Lukas Lundström
makeReactiveTrigger <- function() {
rv <- shiny::reactiveValues(a = 0L)
n_obs <- 0L
list(
depend = function() {
rv$a
invisible()
},
trigger = function() {
rv$a <- isolate(rv$a + 1L)
},
delayedTrigger = function(ms = 500, reTrigger = FALSE) {
a <- isolate(rv$a)
reRun <- FALSE
obs <- observe({
#isolate(print(paste("delayedTrigger", rv$a, a, n_obs, reRun)))
reRun <<- !reRun
if (reRun) {
n_obs <<- n_obs + 1L
shiny::invalidateLater(ms)
return()
}
# don't trigger if there are more obs in cue
# if checkIfTriggered == TRUE: only trigger if not already triggered
if (n_obs == 1L && ((!reTrigger && isolate(identical(a, rv$a))) | reTrigger))
rv$a <- isolate(rv$a + 10L)
n_obs <<- n_obs - 1L
obs$destroy()
}, priority = 100)
}
)
}
calcTrigger <- makeReactiveTrigger()
Reply all
Reply to author
Forward
0 new messages