Hectic resource utilisation correlated with time

Marcin
<marcin.wojno.mail@gmail.com>Recently, every day we experience a strange pattern during the data upload. No matter what time it starts, at the beginning there are hectic changes is most of the metrics (cpu, disk read/write mb/s, compactions, task processed along with storage proxy write timeouts). Latency hurts. After some time it "calms down", both read/write latencies are back to normal and metrics seem to be steady. The most interesting/disturbing part is that seem to be correlated with time. E.g. one day upload started at 12:00 UTC and calmed down ~12:12. The next day it started 20 minutes earlier and calmed down ~12:15. The other day it started at 10:40 and calmed down similarily ~12:15. In general, out of last few days, it started at different times (+/- 2h) and almost every time calms down at the same moment - ~12:10. Only once the pattern didn't repeat itself but it got moved backwards exactly 2h.

Avi Kivity
<avi@scylladb.com>Can you share metric snapshots that show the problem? From the
main and advanced dashboards.
One thing to check is whether fstrim.service was run by systemd
at that time.
--
You received this message because you are subscribed to the Google Groups "ScyllaDB users" group.
To unsubscribe from this group and stop receiving emails from it, send an email to scylladb-user...@googlegroups.com.
To view this discussion on the web visit https://groups.google.com/d/msgid/scylladb-users/fec70669-7b2b-4c0a-b59d-0463e00b9381n%40googlegroups.com.
Marcin
<marcin.wojno.mail@gmail.com>Avi Kivity
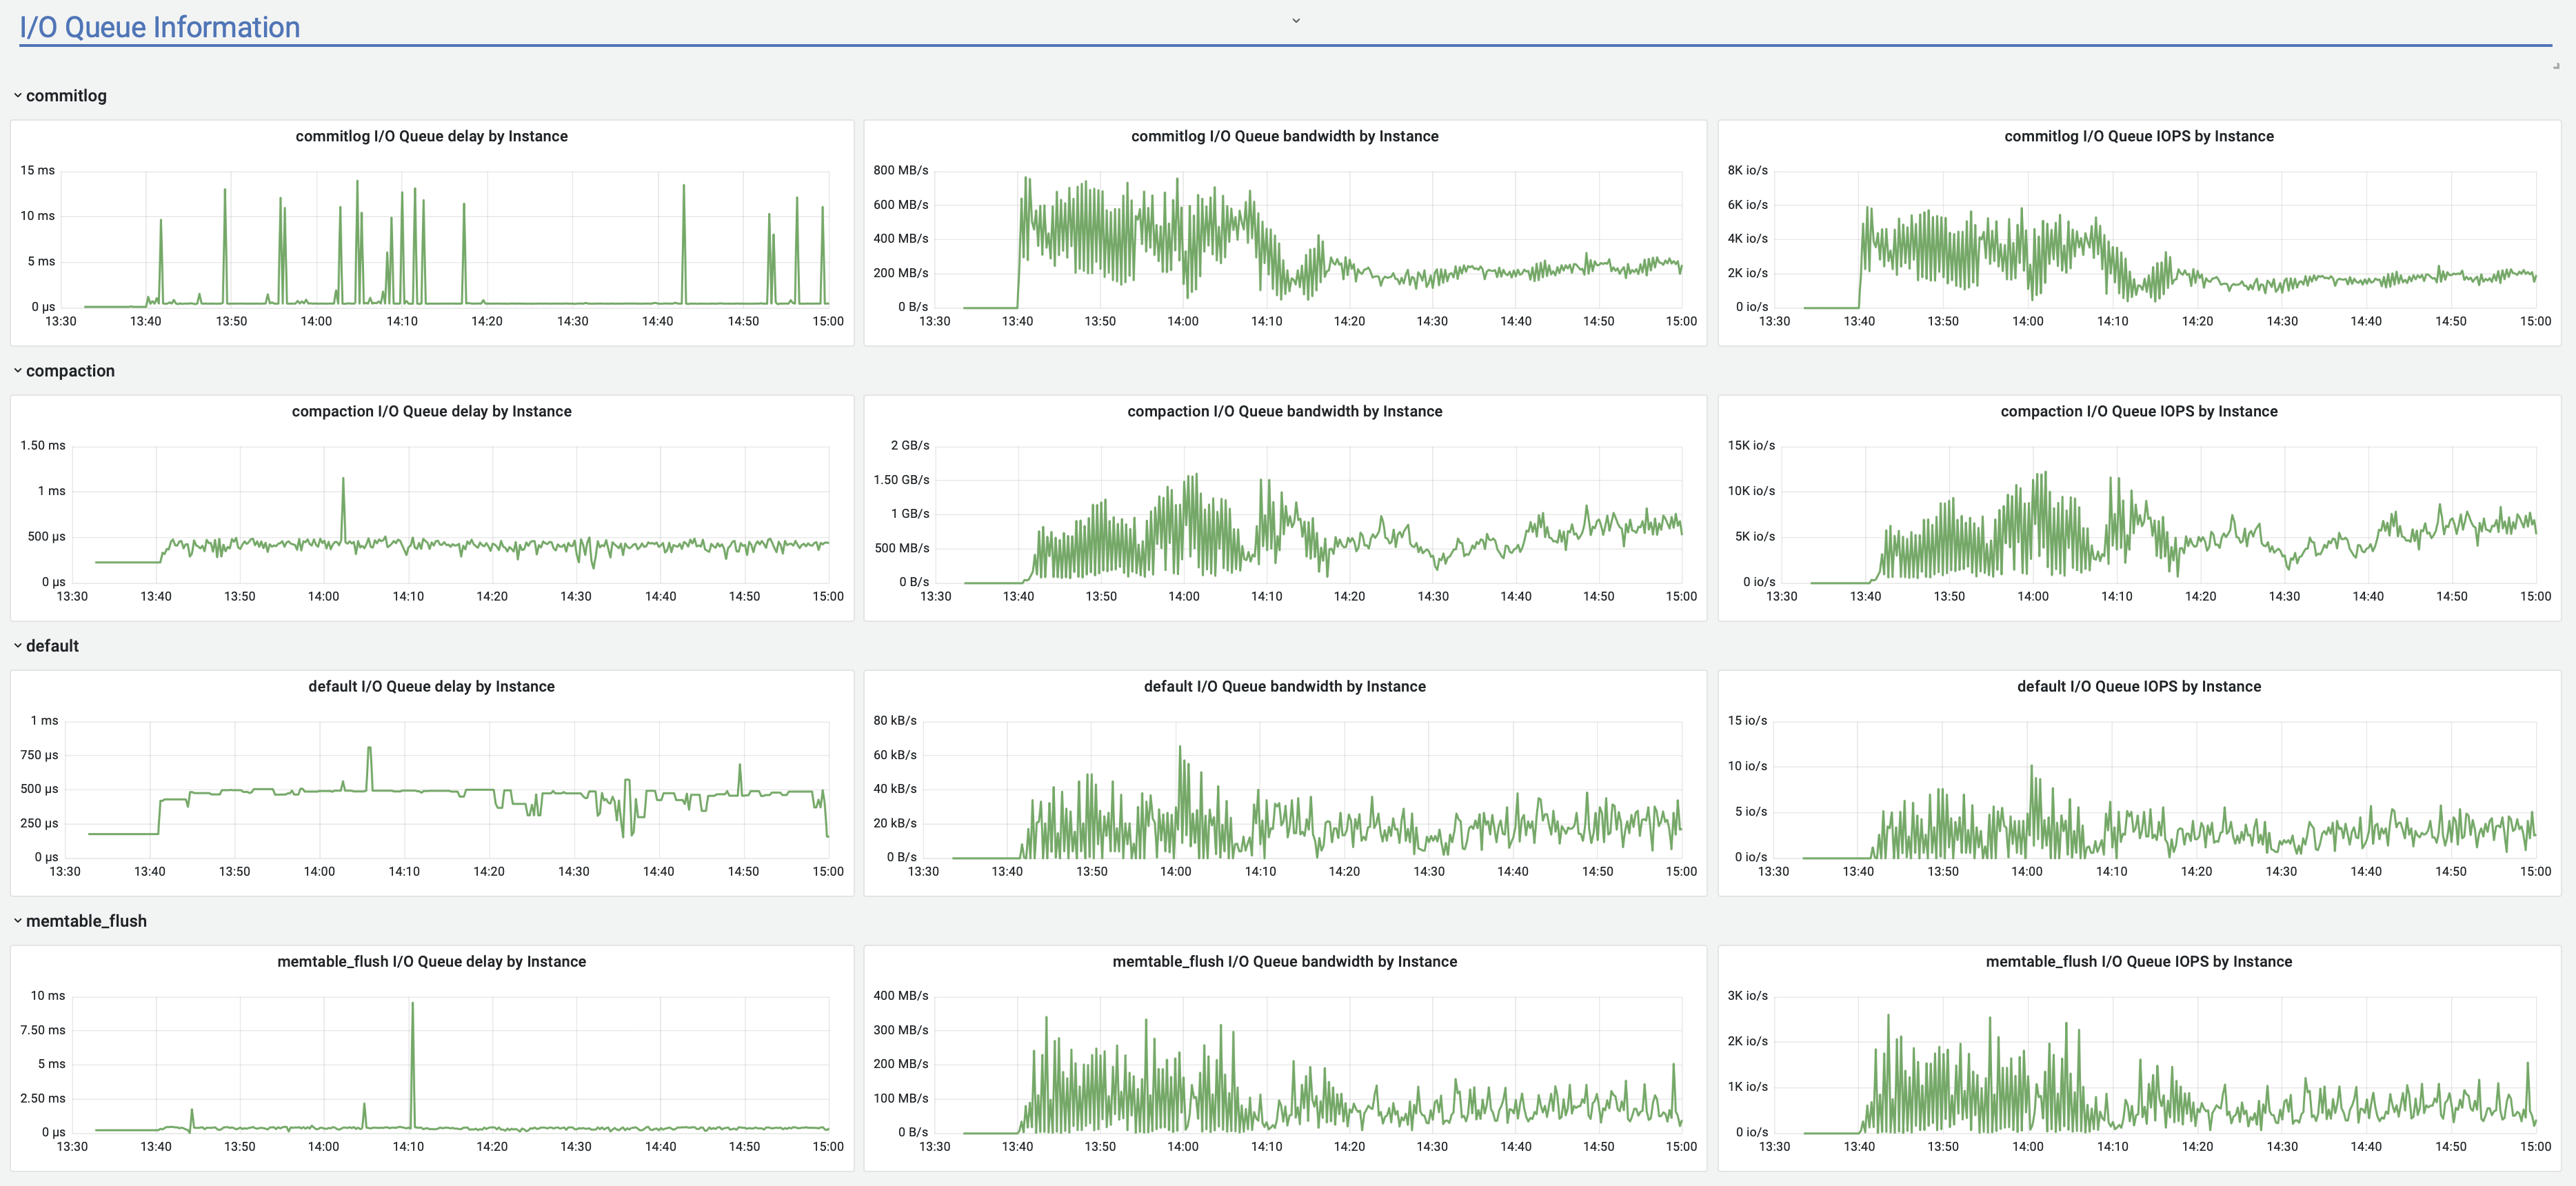
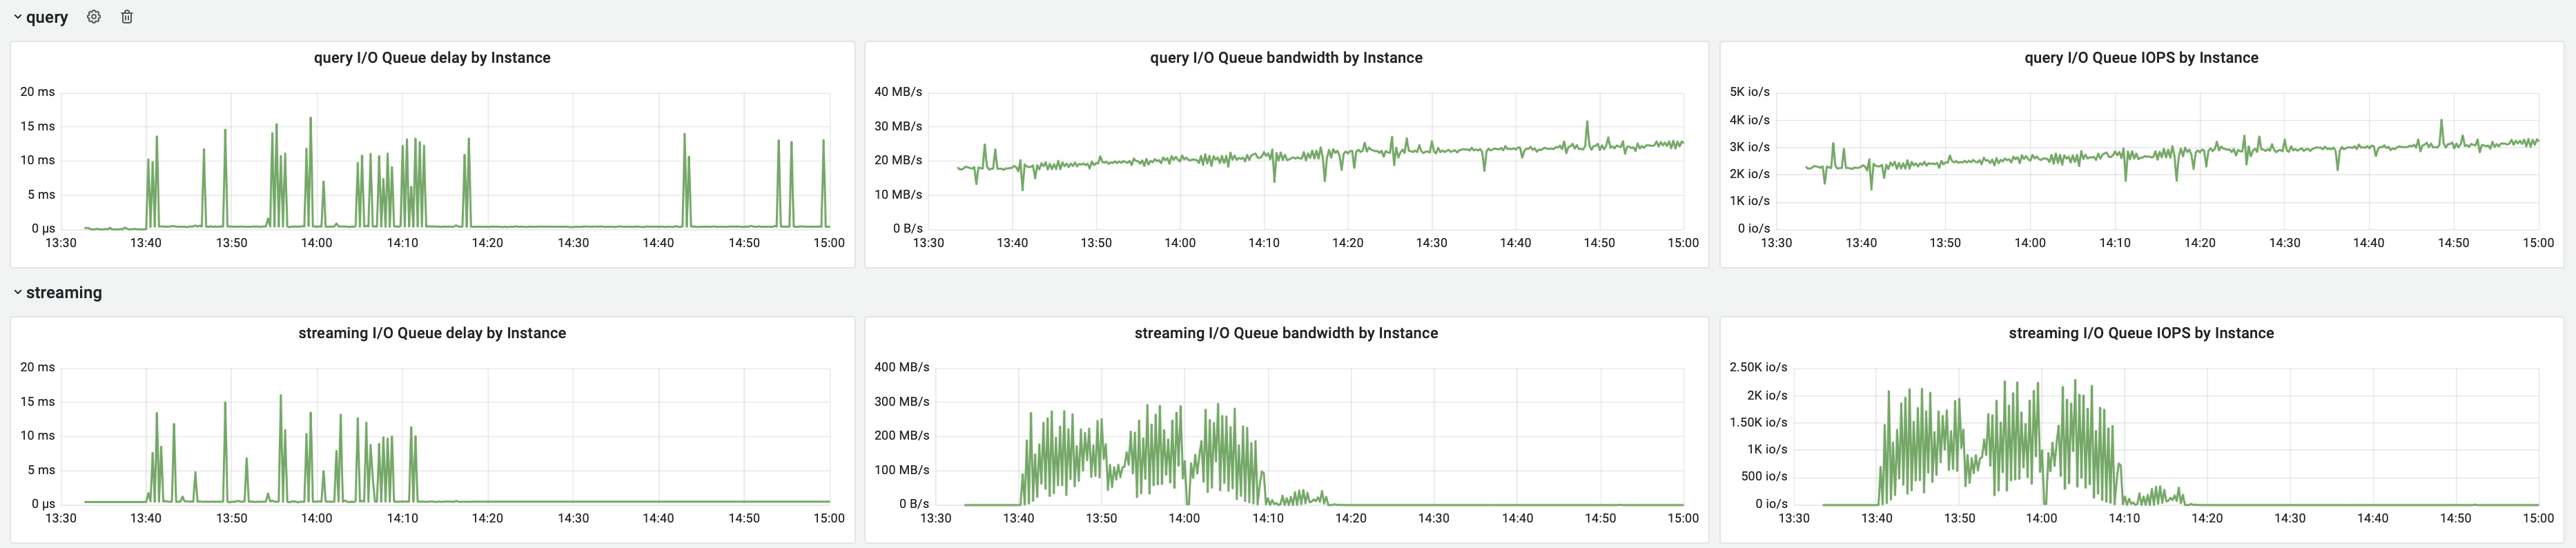
<avi@scylladb.com>Everything looks good, but the most important chart is missing -
Query I/O Queue details.
To view this discussion on the web visit https://groups.google.com/d/msgid/scylladb-users/26ea1842-c9ad-4695-8521-d034fa0c8f68n%40googlegroups.com.
Avi Kivity
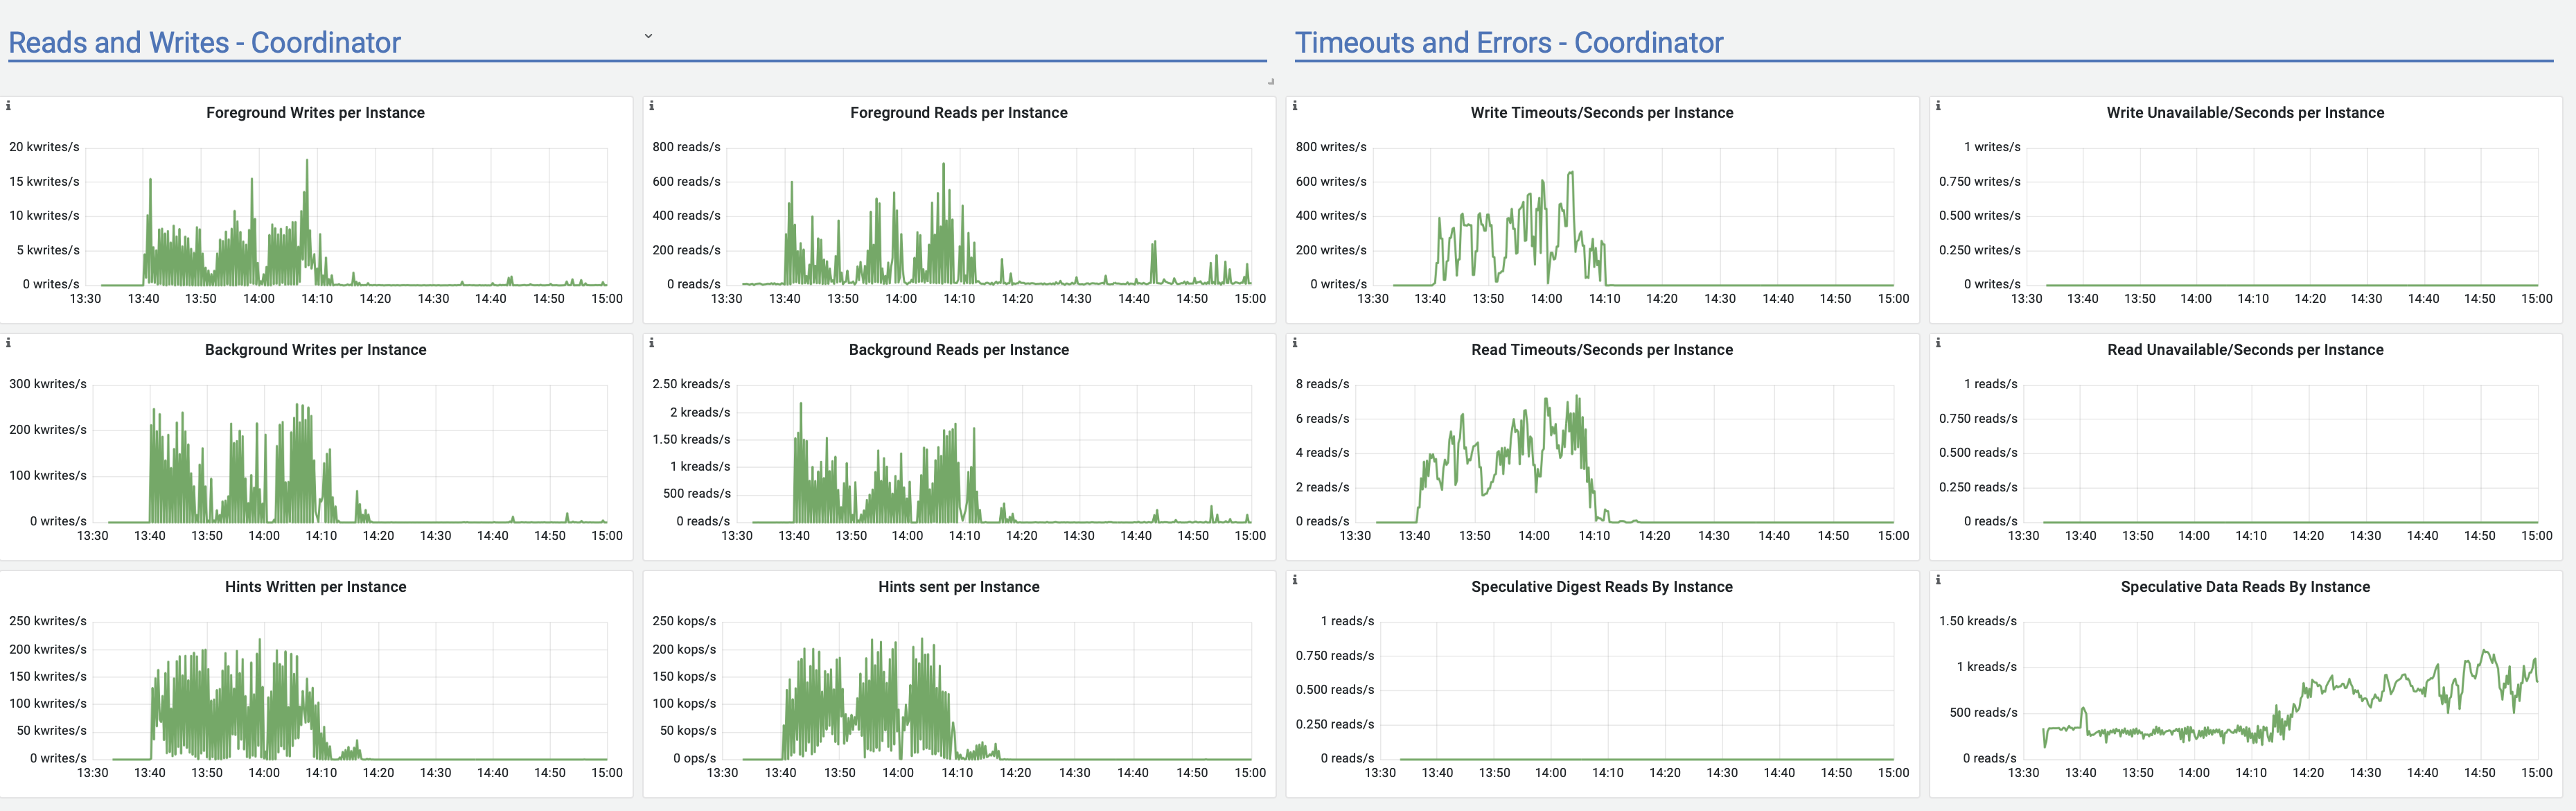
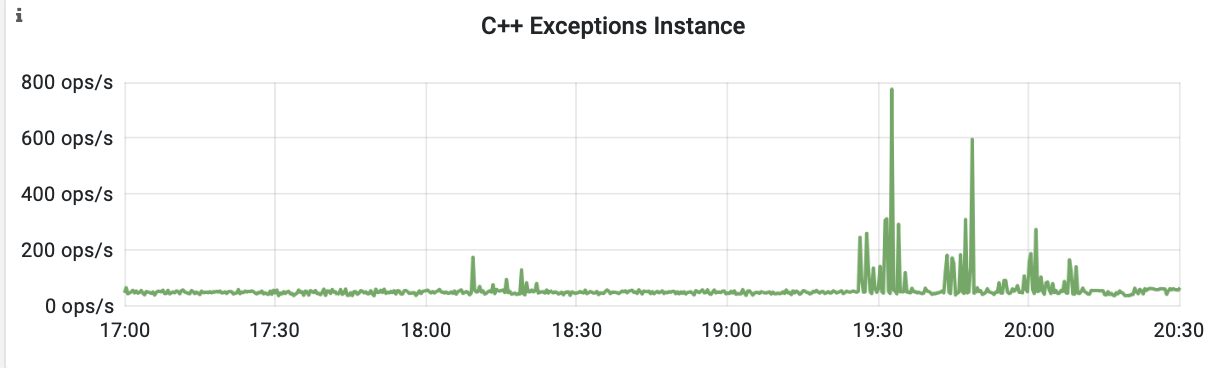
<avi@scylladb.com>I meant that there is no trace of anything bad there. Although I overlooked the C++ exceptions spike, and the timeouts. So it doesn't all look good.
I/O queue delays show spikes of around 10ms. Are the timeout settings lower than that?
I see you are issuing batches, are those logged or unlogged batches?
Anything interesting in the logs?
To view this discussion on the web visit https://groups.google.com/d/msgid/scylladb-users/ea05fbea-69a8-4f62-958c-8d0bec4e4351n%40googlegroups.com.
Marcin
<marcin.wojno.mail@gmail.com>Avi Kivity
<avi@scylladb.com>Did you elevate the batch warning/fail thresholds? If so, it's
probably large batches causing allocation failures and stressing
the allocator. Do you see warnings about reactor stalls in the
logs? What are your batch sizes?
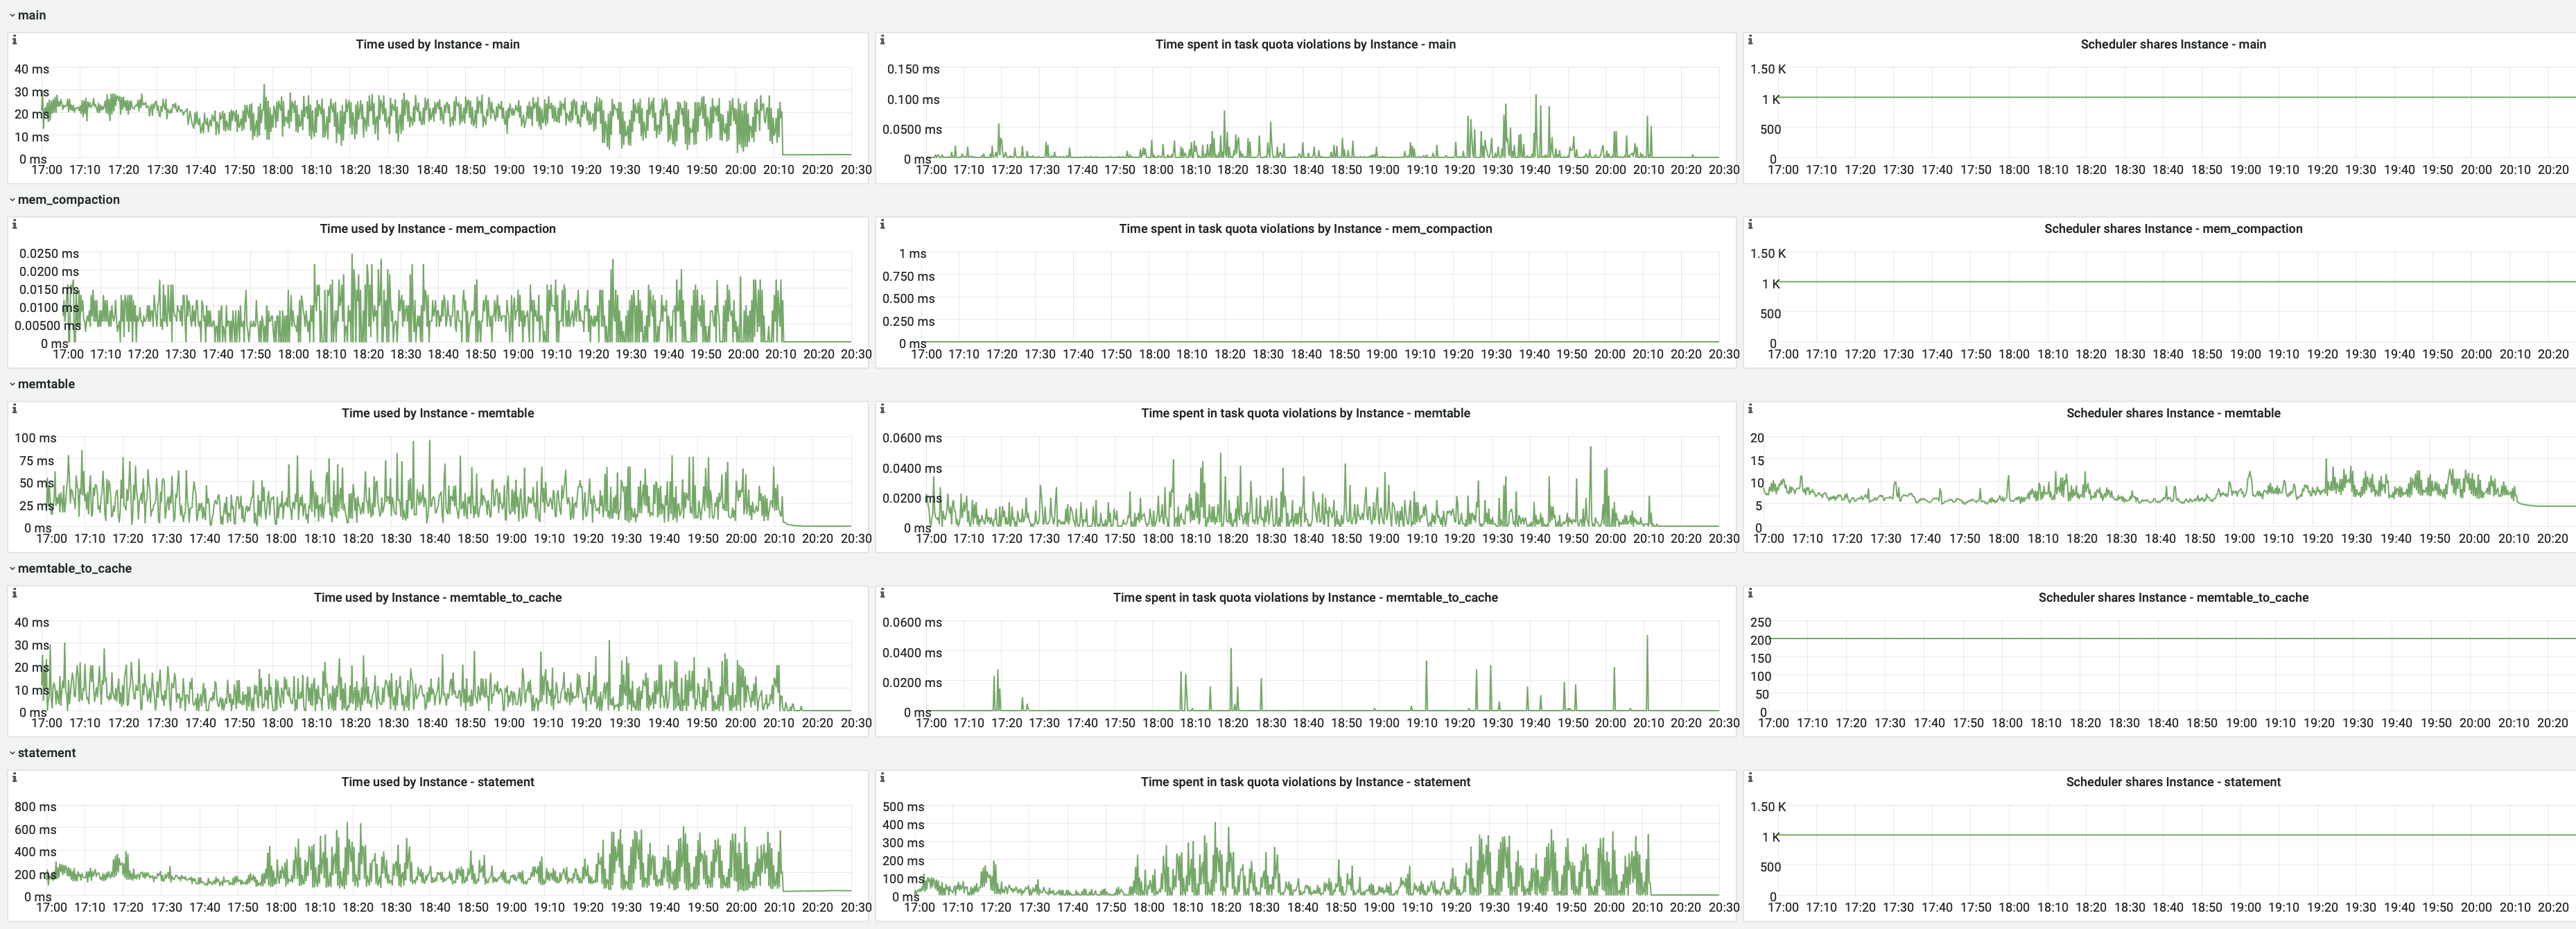
Although, we should have seen task quota violations in the
advanced dashboards, and we didn't.
To view this discussion on the web visit https://groups.google.com/d/msgid/scylladb-users/adbaeb5a-d337-4e7d-bbc6-352d87d62b02n%40googlegroups.com.
Marcin
<marcin.wojno.mail@gmail.com>Avi Kivity
<avi@scylladb.com>Very strange. I saw that the streaming group had activity. Were you running repair or adding a node at the time?
Note that this doesn't explain the problem (since there appear to
be enough bandwidth left over), I'm collecting information.
To view this discussion on the web visit https://groups.google.com/d/msgid/scylladb-users/701a521c-9332-44c6-b540-52d4f56d8e64n%40googlegroups.com.

Gleb Natapov
<gleb@scylladb.com>> Very strange. I saw that the streaming group had activity. Were you running
> repair or adding a node at the time?
>
> > > > > -- You received this message because
> > > > > you are subscribed to
> > > > > the Google Groups "ScyllaDB users" group.
> > > > > To unsubscribe from this group and stop receiving
> > > > > emails from it, send an email to
> > > > > scylladb-user...@googlegroups.com.
> > > > > To view this discussion on the web visit
> > > > > <https://groups.google.com/d/msgid/scylladb-users/26ea1842-c9ad-4695-8521-d034fa0c8f68n%40googlegroups.com?utm_medium=email&utm_source=footer>.
> > > > -- You received this message because you are
> > > > subscribed to the
> > > > Google Groups "ScyllaDB users" group.
> > > > To unsubscribe from this group and stop receiving emails
> > > > from it, send an email to scylladb-user...@googlegroups.com.
> > > > To view this discussion on the web visit
> > > > <https://groups.google.com/d/msgid/scylladb-users/ea05fbea-69a8-4f62-958c-8d0bec4e4351n%40googlegroups.com?utm_medium=email&utm_source=footer>.
> > > -- You received this message because you are subscribed to
> > > the
> > > Google Groups "ScyllaDB users" group.
> > > To unsubscribe from this group and stop receiving emails from it,
> > > send an email to scylladb-user...@googlegroups.com.
> > > To view this discussion on the web visit
> > > <https://groups.google.com/d/msgid/scylladb-users/adbaeb5a-d337-4e7d-bbc6-352d87d62b02n%40googlegroups.com?utm_medium=email&utm_source=footer>.
> > --
> > You received this message because you are subscribed to the Google
> > Groups "ScyllaDB users" group.
> > To unsubscribe from this group and stop receiving emails from it, send
> > an email to scylladb-user...@googlegroups.com.
> --
> You received this message because you are subscribed to the Google Groups "ScyllaDB users" group.
> To unsubscribe from this group and stop receiving emails from it, send an email to scylladb-user...@googlegroups.com.
--
Gleb.
Marcin
<marcin.wojno.mail@gmail.com>Avi Kivity
<avi@scylladb.com>On 05/10/2021 17.24, Gleb Natapov wrote:
> On Tue, Oct 05, 2021 at 05:21:49PM +0300, Avi Kivity wrote:
>> Very strange. I saw that the streaming group had activity. Were you running
>> repair or adding a node at the time?
>>
> IIRC hints use it as well.
>
Marcin
<marcin.wojno.mail@gmail.com>Marcin
<marcin.wojno.mail@gmail.com>Avi Kivity
<avi@scylladb.com>Please switch to shard view to see if there's a shard that
behaves differently. Sometimes the aggregate view can look normal
when a single shard is misbehaving.
Hey.. do you have any ideas how to approach the issue? By the issue I mean that while writes/reads are +/- similar, initially db behaves unstable and suddenly (after certain time) calms down and works just better.
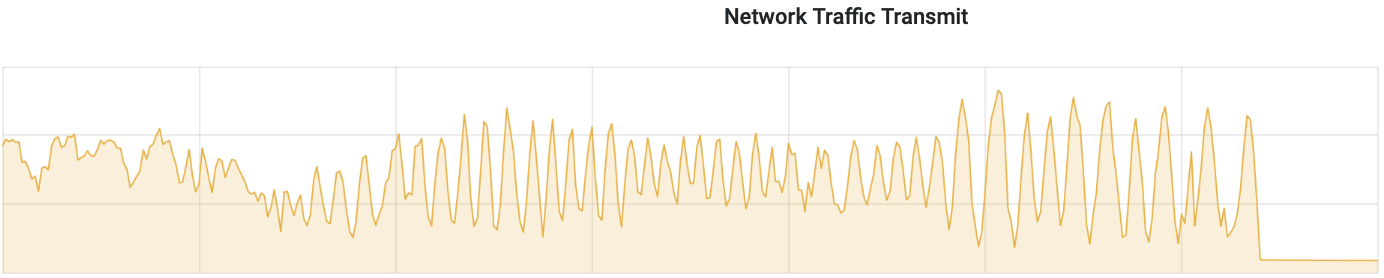
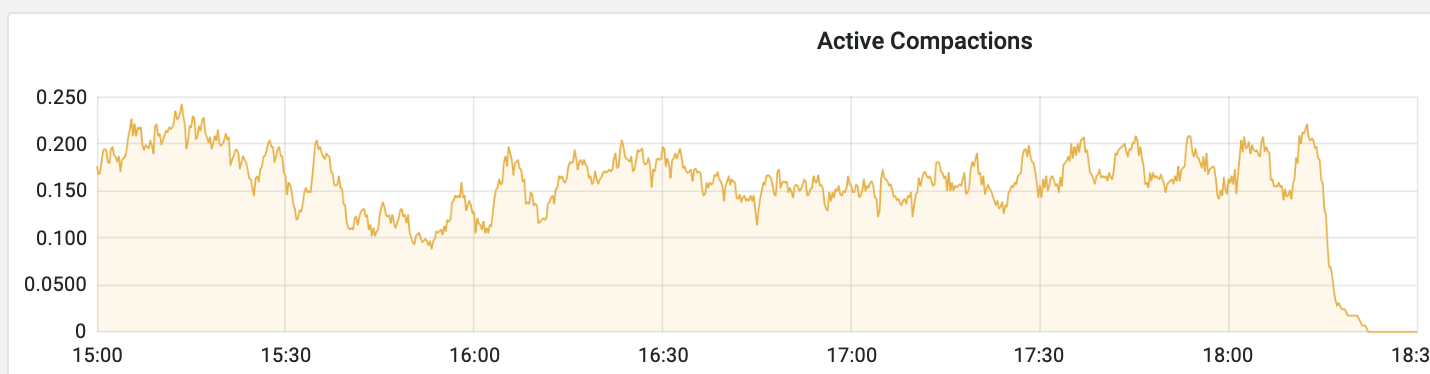
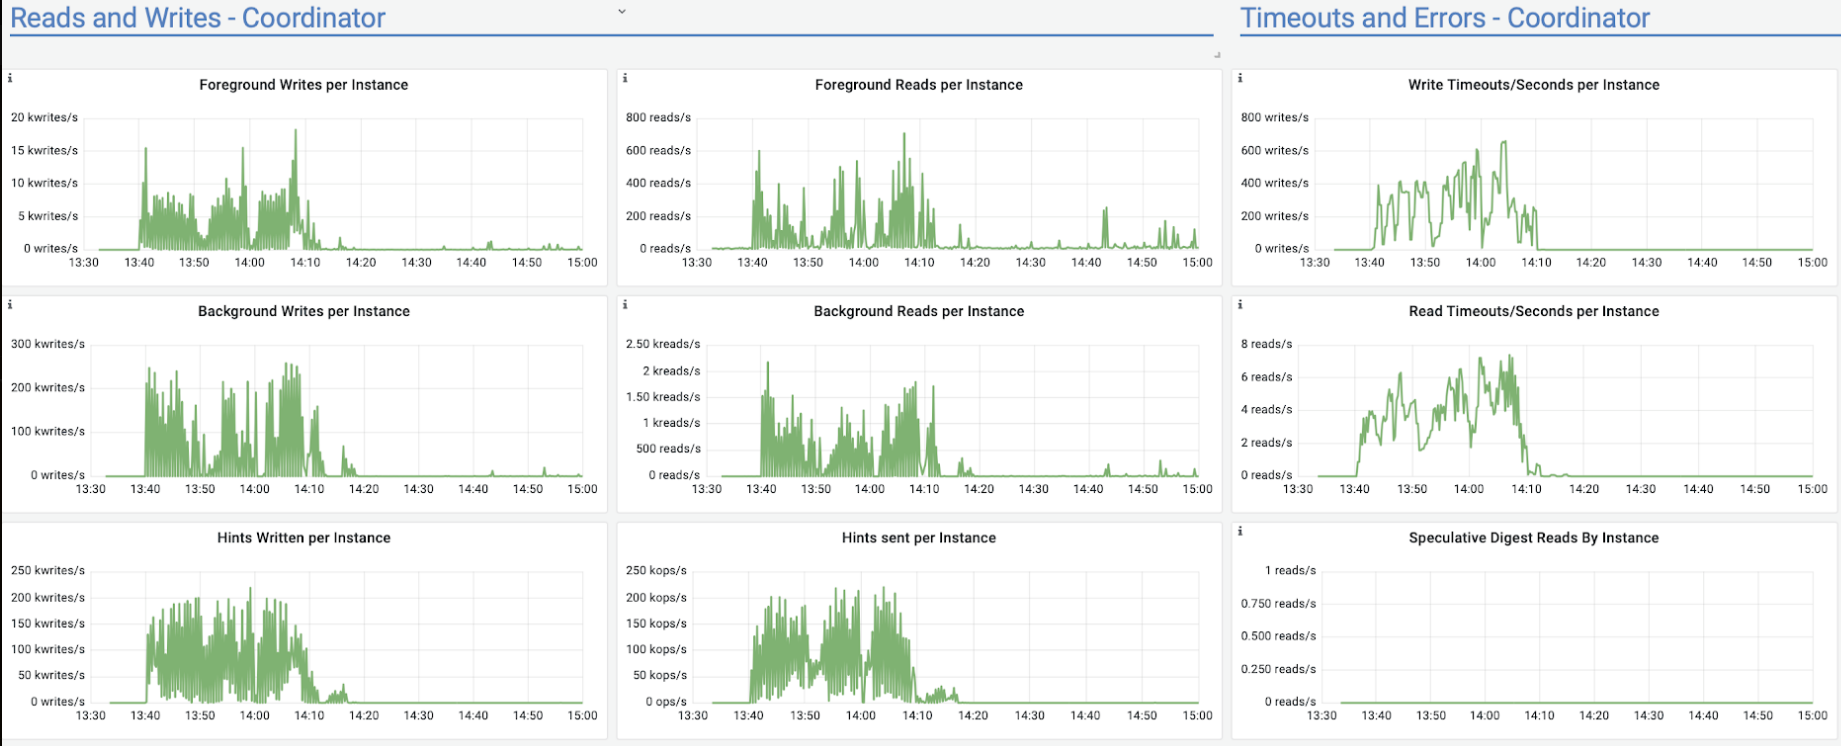
I decreased the upload speed so that the pressure on the nodes is lower but it takes more time. And issues are observable but not that correlated with time. E.g. recently after a few hours of the pretty stable upload it started to behave weird for 2h (until the upload finished) - latency and network transmit had hictic spikes. And also number of Cpp exceptions increased. Checked the system logs and don't see anything of interest there... This is a bit different then previous issues but the pattern that out of the blue behaviour of the db changes seems clear. Attaching screen shots.
--
You received this message because you are subscribed to the Google Groups "ScyllaDB users" group.
To unsubscribe from this group and stop receiving emails from it, send an email to scylladb-user...@googlegroups.com.
To view this discussion on the web visit https://groups.google.com/d/msgid/scylladb-users/1ab146af-0868-4b38-b152-2ea32241fe6bn%40googlegroups.com.
Marcin
<marcin.wojno.mail@gmail.com>
Moreno Garcia
<moreno@scylladb.com>Hey.. do you have any ideas how to approach the issue? By the issue I mean that while writes/reads are +/- similar, initially db behaves unstable and suddenly (after certain time) calms down and works just better.I decreased the upload speed so that the pressure on the nodes is lower but it takes more time. And issues are observable but not that correlated with time. E.g. recently after a few hours of the pretty stable upload it started to behave weird for 2h (until the upload finished) - latency and network transmit had hictic spikes. And also number of Cpp exceptions increased. Checked the system logs and don't see anything of interest there... This is a bit different then previous issues but the pattern that out of the blue behaviour of the db changes seems clear. Attaching screen shots.
--
You received this message because you are subscribed to the Google Groups "ScyllaDB users" group.
To unsubscribe from this group and stop receiving emails from it, send an email to scylladb-user...@googlegroups.com.
To view this discussion on the web visit https://groups.google.com/d/msgid/scylladb-users/1ab146af-0868-4b38-b152-2ea32241fe6bn%40googlegroups.com.
https://calendly.com/moreno-scylla
Check our Scylla Summit 2019 Presentations on Youtube
Marcin
<marcin.wojno.mail@gmail.com>Moreno Garcia
<moreno@scylladb.com>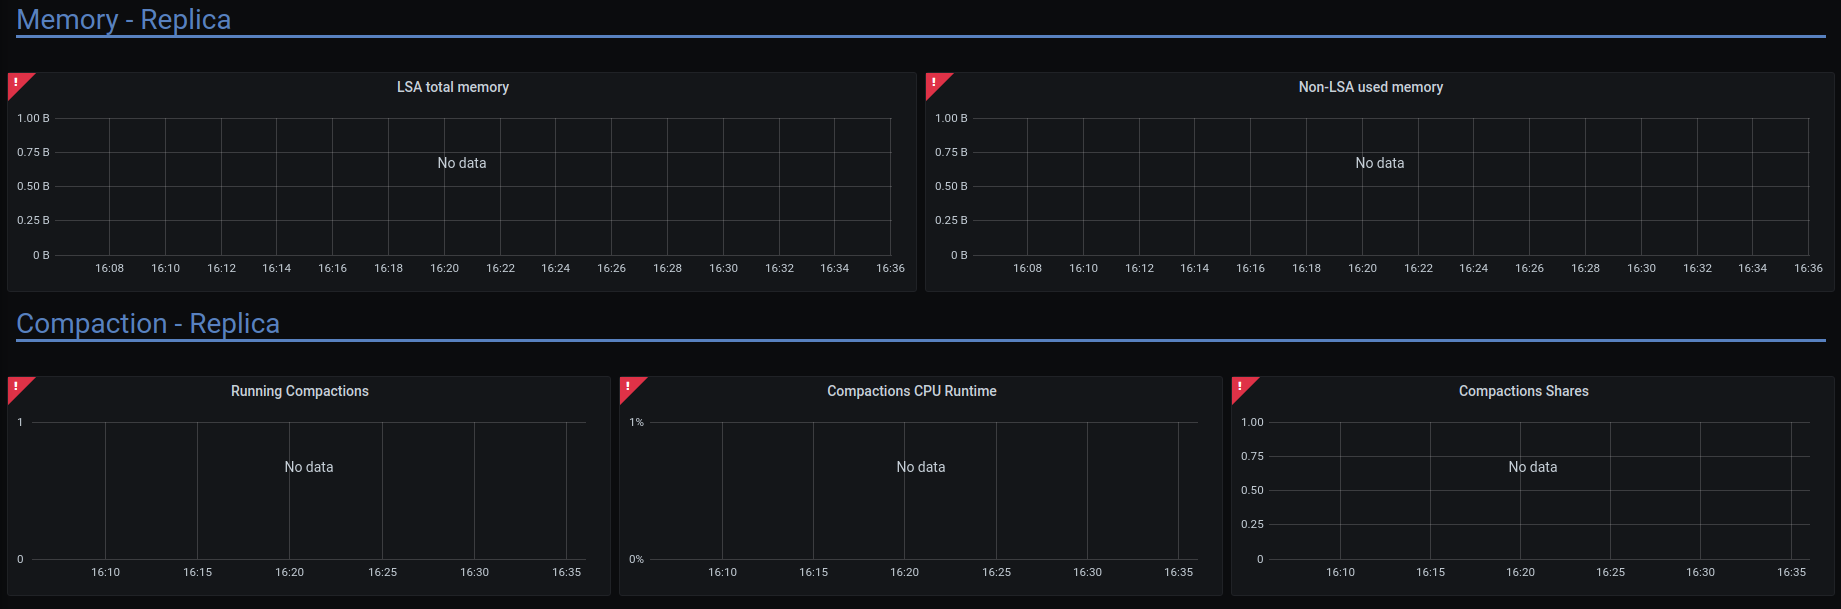
To view this discussion on the web visit https://groups.google.com/d/msgid/scylladb-users/bfadbe98-398b-47d2-b552-b511127a0c41n%40googlegroups.com.
Marcin
<marcin.wojno.mail@gmail.com>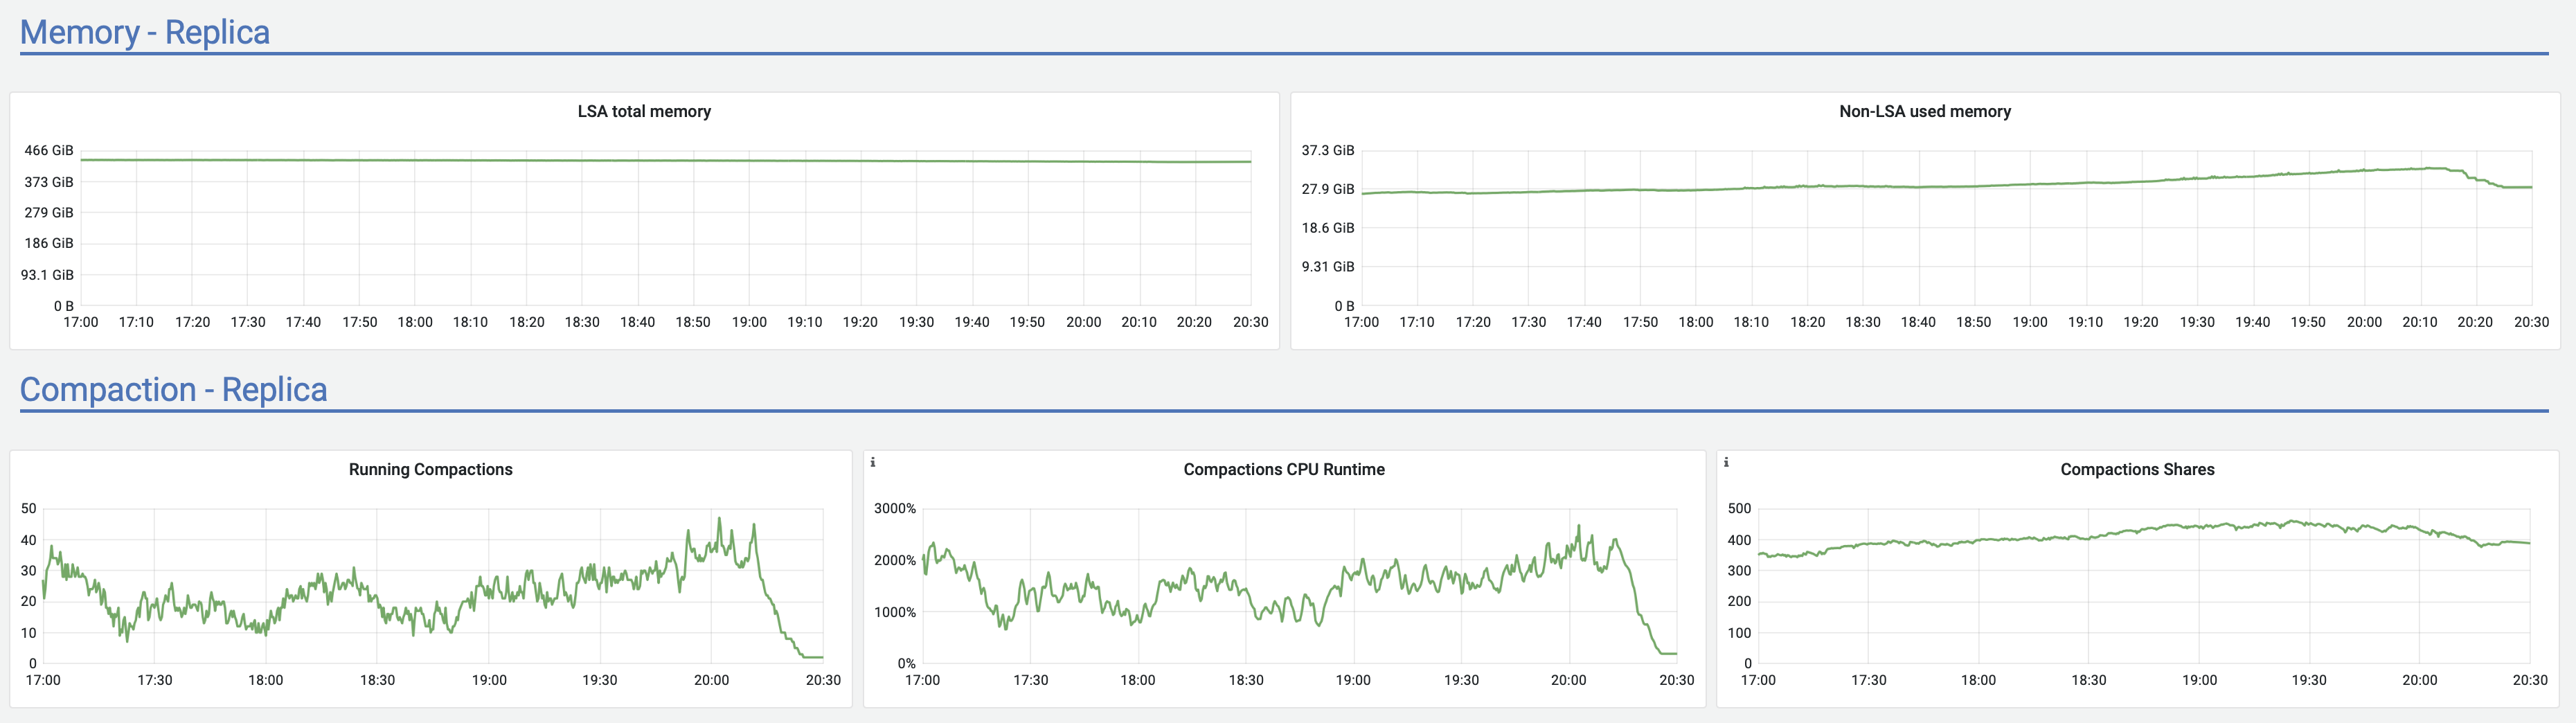

Moreno Garcia
<moreno@scylladb.com>Oh, sorry. This is for the last case I mentioned - when after a few hours of upload it started to act strange (visible in the latencies graph starting after 18:00) until the very end of upload.And this is the same graph for the initial case, where upload acted strange until +/- 12:10 UTC which was the pattern for at least a week straight no matter the time upload started (graphs are in CET, so moved 2 hours forward). It seems correlated with vibrations in the Non-LSA used memory:


To view this discussion on the web visit https://groups.google.com/d/msgid/scylladb-users/534ea5b0-b4d9-4d06-bb49-bed3ffce64adn%40googlegroups.com.