Scaling trouble

64 views
Skip to first unread message

Robert Hayre

<robert@rtbiq.com>
unread,
Aug 8, 2021, 12:51:22 AM8/8/21
to ScyllaDB users

I am running a DC with 9 i3.2xlarge instances running the stock ScyllaDB 4.3.1 AMI in AWS EC2 in a single availability zone.

The read pattern consists of LOCAL_ONE queries that target single partitions and return all rows, amounting to payloads averaging much less than one kilobyte, but with some payloads over this size. The client is the official Python cassandra-driver, although I have tried scylla-driver to no effect. This client employs the usual TokenAwarePolicy(DCAwareRoundRobinPolicy). There are about 500 processes across many nodes with their own shared client instance.

Given these provisions and the data/query model, I would expect the “rule-of-thumb” to be at play here, where let’s say 10k ops/sec comes from each physical core in the cluster, so 9 nodes x 4 phys. cores per node x 10k ops/core = 36k ops/sec.

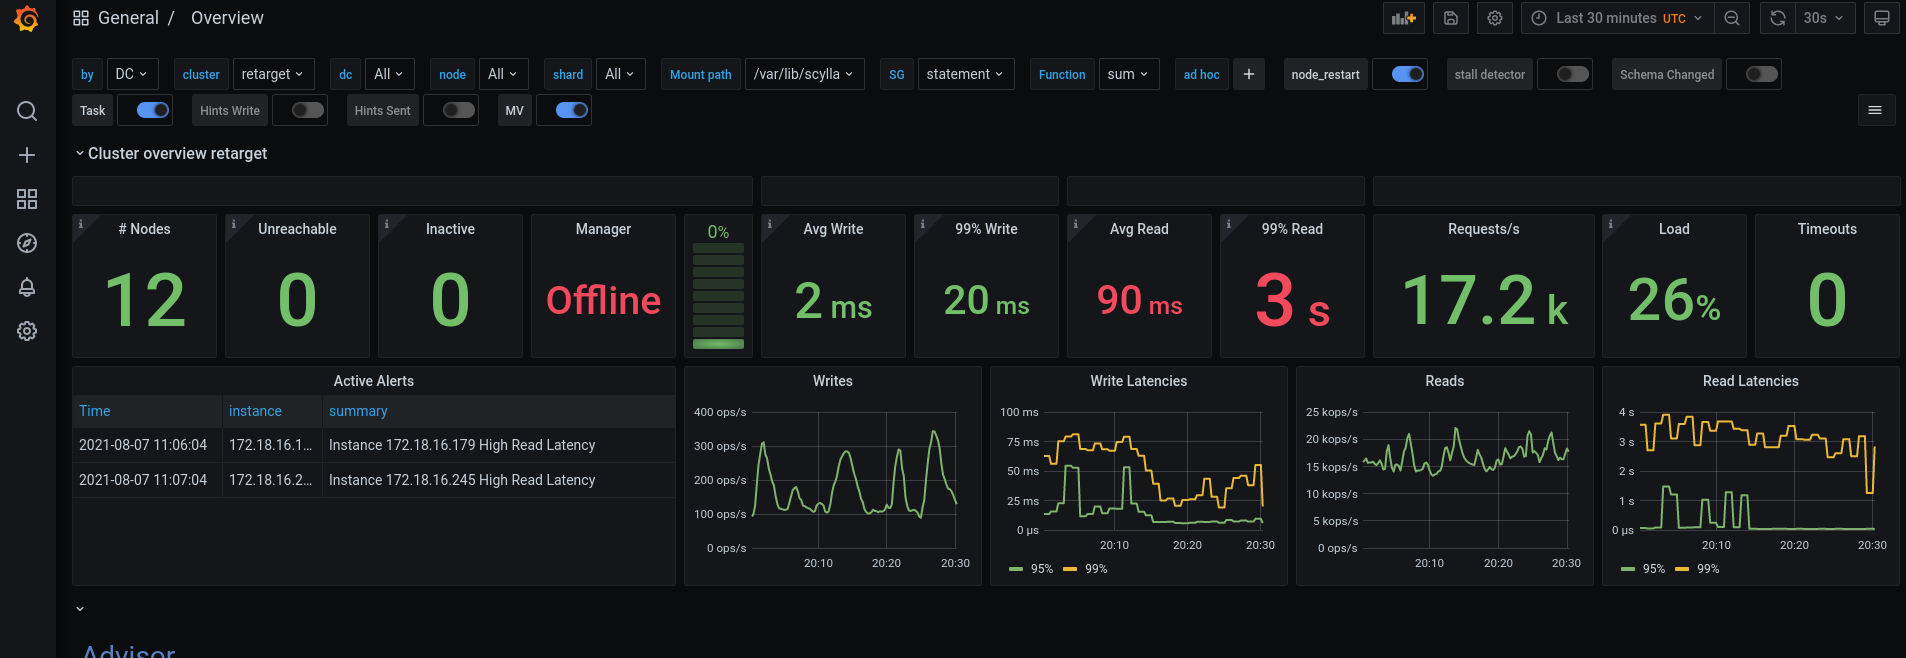
However, there is clearly a problem that manifests as timeouts on the client side, and obviously high read latency (in the seconds at p99) as reported by nodetool and as evidenced in the Scylla Monitoring Stack that I recently set up. Please see the attached snapshot of the “Overview” dashboard, where reads/sec is at a modest 17k/sec.  The high latency tail disappears at some lower threshold of reads/sec.

Does this seem strange to anyone? I’m likely to have missed some important information or data, which I’d be glad to provide.

Thanks,
Robert


Scylla-Monitoring-Stack-high-read-latency.png

Tomer Sandler

<tomer@scylladb.com>
unread,
Aug 8, 2021, 1:13:06 AM8/8/21
to scylladb-users@googlegroups.com
How many connections do you have per shard?
(I suspect you either don't have enough connections to saturate Scylla, or you might have a hot partition creating a bottleneck)

In the screenshot you shared you can see the cpu-reactor load at 26%, so your cluster is doing 17.2K ops, but you are hardly stressing scylla.

You can see the num of cql connections in one of the dashboards, there's a panel for that (select the node,shard view).

Also in the overview dashboard, change to node,shard view to see if you might have a hot partition (a lot of requests being served by a specific shard), which might be creating a bottleneck.

You should also check out the CQL optimization dashboard for additional possible misdoings application client wise.


Application best practices blog post:

CQL optimization dashboard:


--
Tomer Sandler
ScyllaDB

(Sent from my android)

--
You received this message because you are subscribed to the Google Groups "ScyllaDB users" group.
To unsubscribe from this group and stop receiving emails from it, send an email to scylladb-user...@googlegroups.com.
To view this discussion on the web visit https://groups.google.com/d/msgid/scylladb-users/d71162d9-6d6e-411e-a591-a74cf3f181e4n%40googlegroups.com.

Tomer Sandler

<tomer@scylladb.com>
unread,
Aug 8, 2021, 1:16:15 AM8/8/21
to scylladb-users@googlegroups.com


--
Tomer Sandler
ScyllaDB

(Sent from my android)

Robert Hayre

<robert@rtbiq.com>
unread,
Aug 9, 2021, 2:08:42 PM8/9/21
to ScyllaDB users
Tomer:

Thank you for the ideas and the references.  I will investigate in the coming days and report back.

Regards,
Robert

Avishai Ish Shalom

<avishai.ishshalom@scylladb.com>
unread,
Aug 10, 2021, 6:16:53 AM8/10/21
to ScyllaDB users
It would help a lot if you could post the queries and schema, this may have something to do with the way data is partitioned. 

Robert Hayre

<robert@rtbiq.com>
unread,
Aug 17, 2021, 1:22:53 AM8/17/21
to ScyllaDB users

Regarding the number of connections per shard: There are about 500 separate processes with their own Cluster instance, and there are 8 shards per i3.2xlarge node.

As an update, there was a crash that led to losing several nodes, and new nodes were only able to bootstrap after upgrading to Scylla 4.4.4. There are now 5 i3.2xlarge nodes running the official AMI.

To respond to Avishai’s request, here is the table schema:

CREATE  TABLE ks.cf  (                                                                                                                                                                             
    i  ascii,                                                                                                                                                                                     
    A  ascii,                                                                                                                                                                                     
    B  ascii,                                                                                                                                                                                     
    C  ascii,                                                                                                                                                                                     
    D  text,                                                                                                                                                                                      
    t  timestamp,                                                                                                                                                                                 
    PRIMARY KEY (i, A, B, C, D,  t)                                                                                                                                                               
) WITH CLUSTERING ORDER BY (A ASC, B ASC, C ASC, D ASC, t  ASC)                                                                                                                                   
    AND bloom_filter_fp_chance =  0.01                                                                                                                                                            
    AND caching = {'keys': 'ALL', 'rows_per_partition':  'ALL'}                                                                                                                                   
    AND comment =  ''                                                                                                                                                                             
    AND compaction = {'class': 'TimeWindowCompactionStrategy',  'compaction_window_size': '3', 'compaction_window_unit': 'DAYS',  'tombstone_compaction_interval': '7776010'}                     
     AND compression = {'sstable_compression':  'org.apache.cassandra.io.compress.LZ4Compressor'}                                                                                                  
    AND crc_check_chance =  1.0                                                                                                                                                                   
    AND dclocal_read_repair_chance =  0.0                                                                                                                                                         
    AND default_time_to_live =  7776000                                                                                                                                                           
    AND gc_grace_seconds =  10                                                                                                                                                                    
    AND max_index_interval =  2048                                                                                                                                                                
    AND memtable_flush_period_in_ms =  0                                                                                                                                                          
    AND min_index_interval =  128                                                                                                                                                                 
    AND read_repair_chance =  0.0                                                                                                                                                                 
    AND speculative_retry =  'NONE';

The following snippet shows the connection setup and describes the read pattern:

session  =  Cluster(                                                                                                                                                                               
    ['cluster.dns.name'],  port=19042,                                                                                                                                                            
    execution_profiles={EXEC_PROFILE_DEFAULT:  ExecutionProfile(load_balancing_policy=TokenAwarePolicy(DCAwareRoundRobinPolicy()))}                                                               
).connect()                                                                                                                                                                                      
insert = session.prepare('INSERT INTO ks.cf (i, A, B, C, D, t)  VALUES (?, ?, ?, ?, ?,  ?)')                                                                                                       
insert.consistency_level =  ConsistencyLevel.LOCAL_QUORUM                                                                                                                                         
get = session.prepare("SELECT A, B, C, D, count(*), max(t) FROM  ks.cf WHERE i = ? GROUP BY A, B, C,  D")                                                                                          
get.consistency_level =  ConsistencyLevel.LOCAL_ONE

Is this a rather heavy query?

To give an example of threshold behavior, here is a DC Overview below the threshold where problems occur:
running-smoothly.png

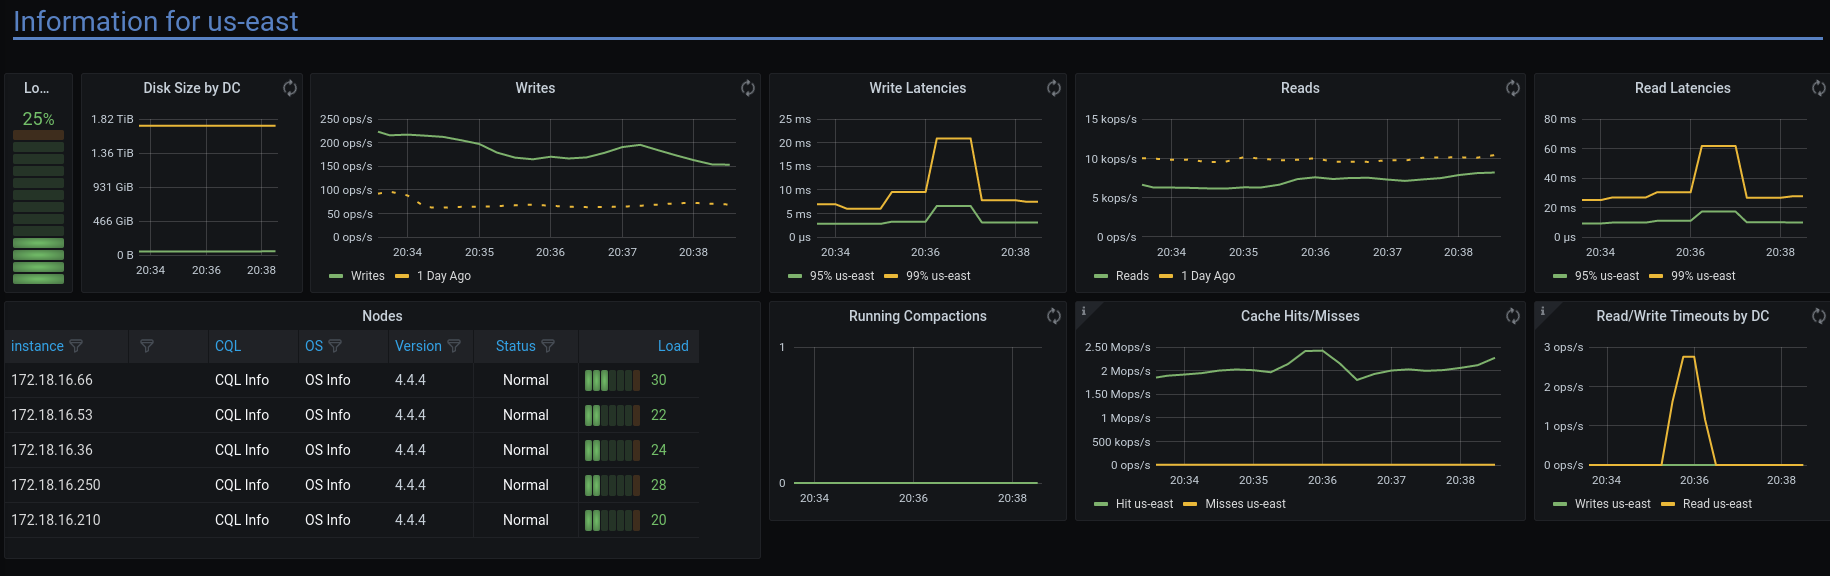
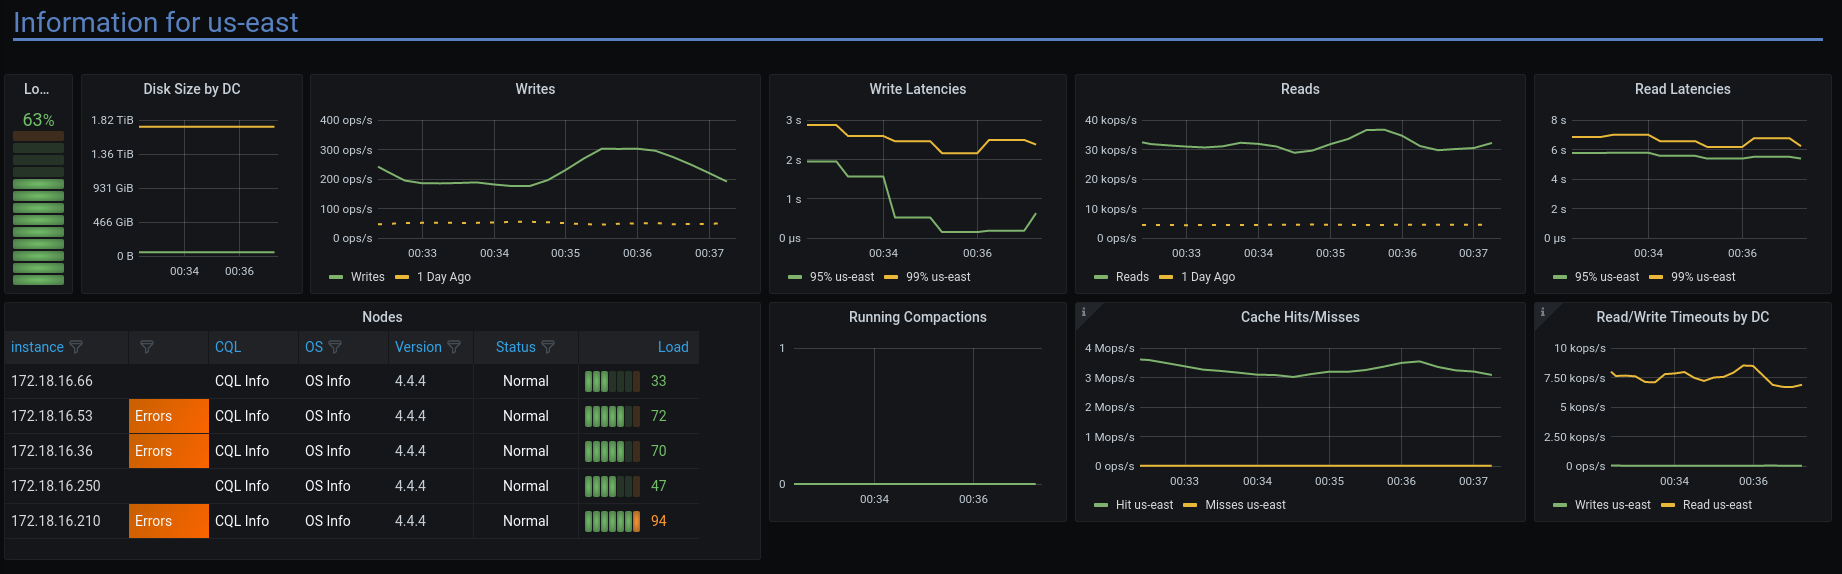
And here is an Overview somewhere above the threshold (which must be between 7,500 ops/sec and 30,000 ops/sec):

running-rough.png

Also, here is a view of the p99 latency in milliseconds, where groups of shards are in the single-digit seconds, and these shards seems to be grouped on nodes with disproportionate load:

read-latency-by-shard.png

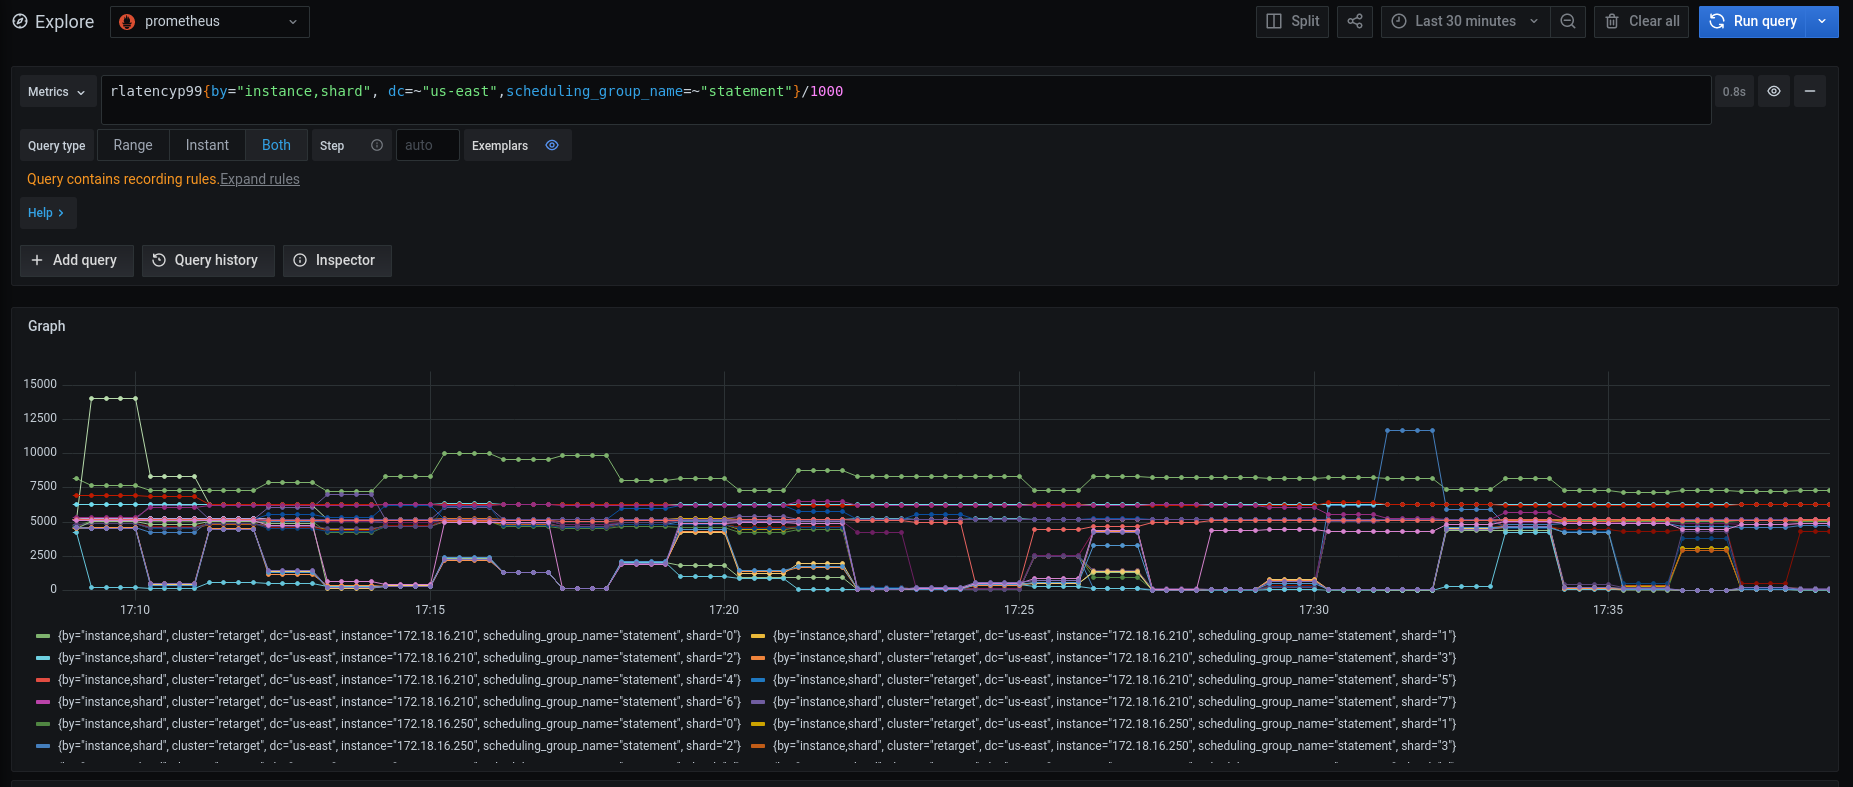
These snapshots are in a case where load only emanated from 5 client instances with about 170 processes/connections.

I hope this is helpful towards understanding the situation!

Best,
Robert

Reply all
Reply to author
Forward
0 new messages