color maps ok in sage (local), not working on SMC
74 views
Skip to first unread message

Juan Carlos Bustamante
Sep 16, 2016, 12:01:03 PM9/16/16
to sage-cloud
Hello all,
I tried this code
both in SMC and in SageMath running on my lpatop (7.2 on Ubuntu 16.04)
While the result on my laptop is exactly what I expected, in SMC i get a 1-colored figure. Any ide about what to do?
Thanks!
JC
I tried this code
u,v = var('u,v')
def cf(u,v): return sin(u+v/2)**2
P = parametric_plot3d((cos(u), sin(u) + cos(v), sin(v)), (u, 0, 2*pi), (v, -pi, pi), color=(cf, colormaps.PiYG), plot_points=[60,60])
P.show()
both in SMC and in SageMath running on my lpatop (7.2 on Ubuntu 16.04)
While the result on my laptop is exactly what I expected, in SMC i get a 1-colored figure. Any ide about what to do?
Thanks!
JC

Harald Schilly
Sep 16, 2016, 12:08:11 PM9/16/16
to sage-cloud
Those 3D plots don't have that color information. I think this PR,
once positively reviewed and made live, would add this functionality:
https://github.com/sagemathinc/smc/pull/830
-- harald
once positively reviewed and made live, would add this functionality:
https://github.com/sagemathinc/smc/pull/830
-- harald
Juan Carlos Bustamante
Sep 16, 2016, 12:49:18 PM9/16/16
to sage-cloud
I see. Is there anything I could do? How complex is the "review proces", I knot not much about this kind of things, but if this is simple, I would be pleased to do something.
JC
JC

William Stein
Sep 16, 2016, 1:24:18 PM9/16/16
to sage-cloud
On Fri, Sep 16, 2016 at 9:49 AM, Juan Carlos Bustamante
<jotac...@gmail.com> wrote:
> I see. Is there anything I could do? How complex is the "review proces", I
> knot not much about this kind of things, but if this is simple, I would be
> pleased to do something.
I will very likely review this today...
<jotac...@gmail.com> wrote:
> I see. Is there anything I could do? How complex is the "review proces", I
> knot not much about this kind of things, but if this is simple, I would be
> pleased to do something.
>
> JC
>
> El viernes, 16 de septiembre de 2016, 12:08:11 (UTC-4), Harald Schilly
> escribió:
>>
>> Those 3D plots don't have that color information. I think this PR,
>> once positively reviewed and made live, would add this functionality:
>>
>> https://github.com/sagemathinc/smc/pull/830
>>
>> -- harald
>
> You received this message because you are subscribed to the Google Groups
> "sage-cloud" group.
> To unsubscribe from this group and stop receiving emails from it, send an
> email to sage-cloud+...@googlegroups.com.
> To view this discussion on the web visit
> https://groups.google.com/d/msgid/sage-cloud/abf45a4d-7ff8-4fc1-b3b2-7398c4ed9a08%40googlegroups.com.
>
> For more options, visit https://groups.google.com/d/optout.
--
Best Regards,
William Stein
CEO, SageMath, Inc.
William Stein
Sep 18, 2016, 3:07:11 PM9/18/16
to sage-cloud, chap...@math.unistra.fr
On Fri, Sep 16, 2016 at 10:23 AM, William Stein <wst...@sagemath.com> wrote:
> On Fri, Sep 16, 2016 at 9:49 AM, Juan Carlos Bustamante
> <jotac...@gmail.com> wrote:
>> I see. Is there anything I could do? How complex is the "review proces", I
>> knot not much about this kind of things, but if this is simple, I would be
>> pleased to do something.
>
> I will very likely review this today...
Now live. Refresh your browser and restart your project. Example worksheet:
> On Fri, Sep 16, 2016 at 9:49 AM, Juan Carlos Bustamante
> <jotac...@gmail.com> wrote:
>> I see. Is there anything I could do? How complex is the "review proces", I
>> knot not much about this kind of things, but if this is simple, I would be
>> pleased to do something.
>
> I will very likely review this today...
https://cloud.sagemath.com/projects/4a5f0542-5873-4eed-a85c-a18c706e8bcd/files/support/2016-09-18-120242-colormap.sagews
Thanks again to fchapoton !
Juan Carlos Bustamante
Sep 20, 2016, 8:32:25 PM9/20/16
to sage-cloud, chap...@math.unistra.fr
Dear William,
Thanks a lot. I tried the parametric plot version, which resulted in an error.
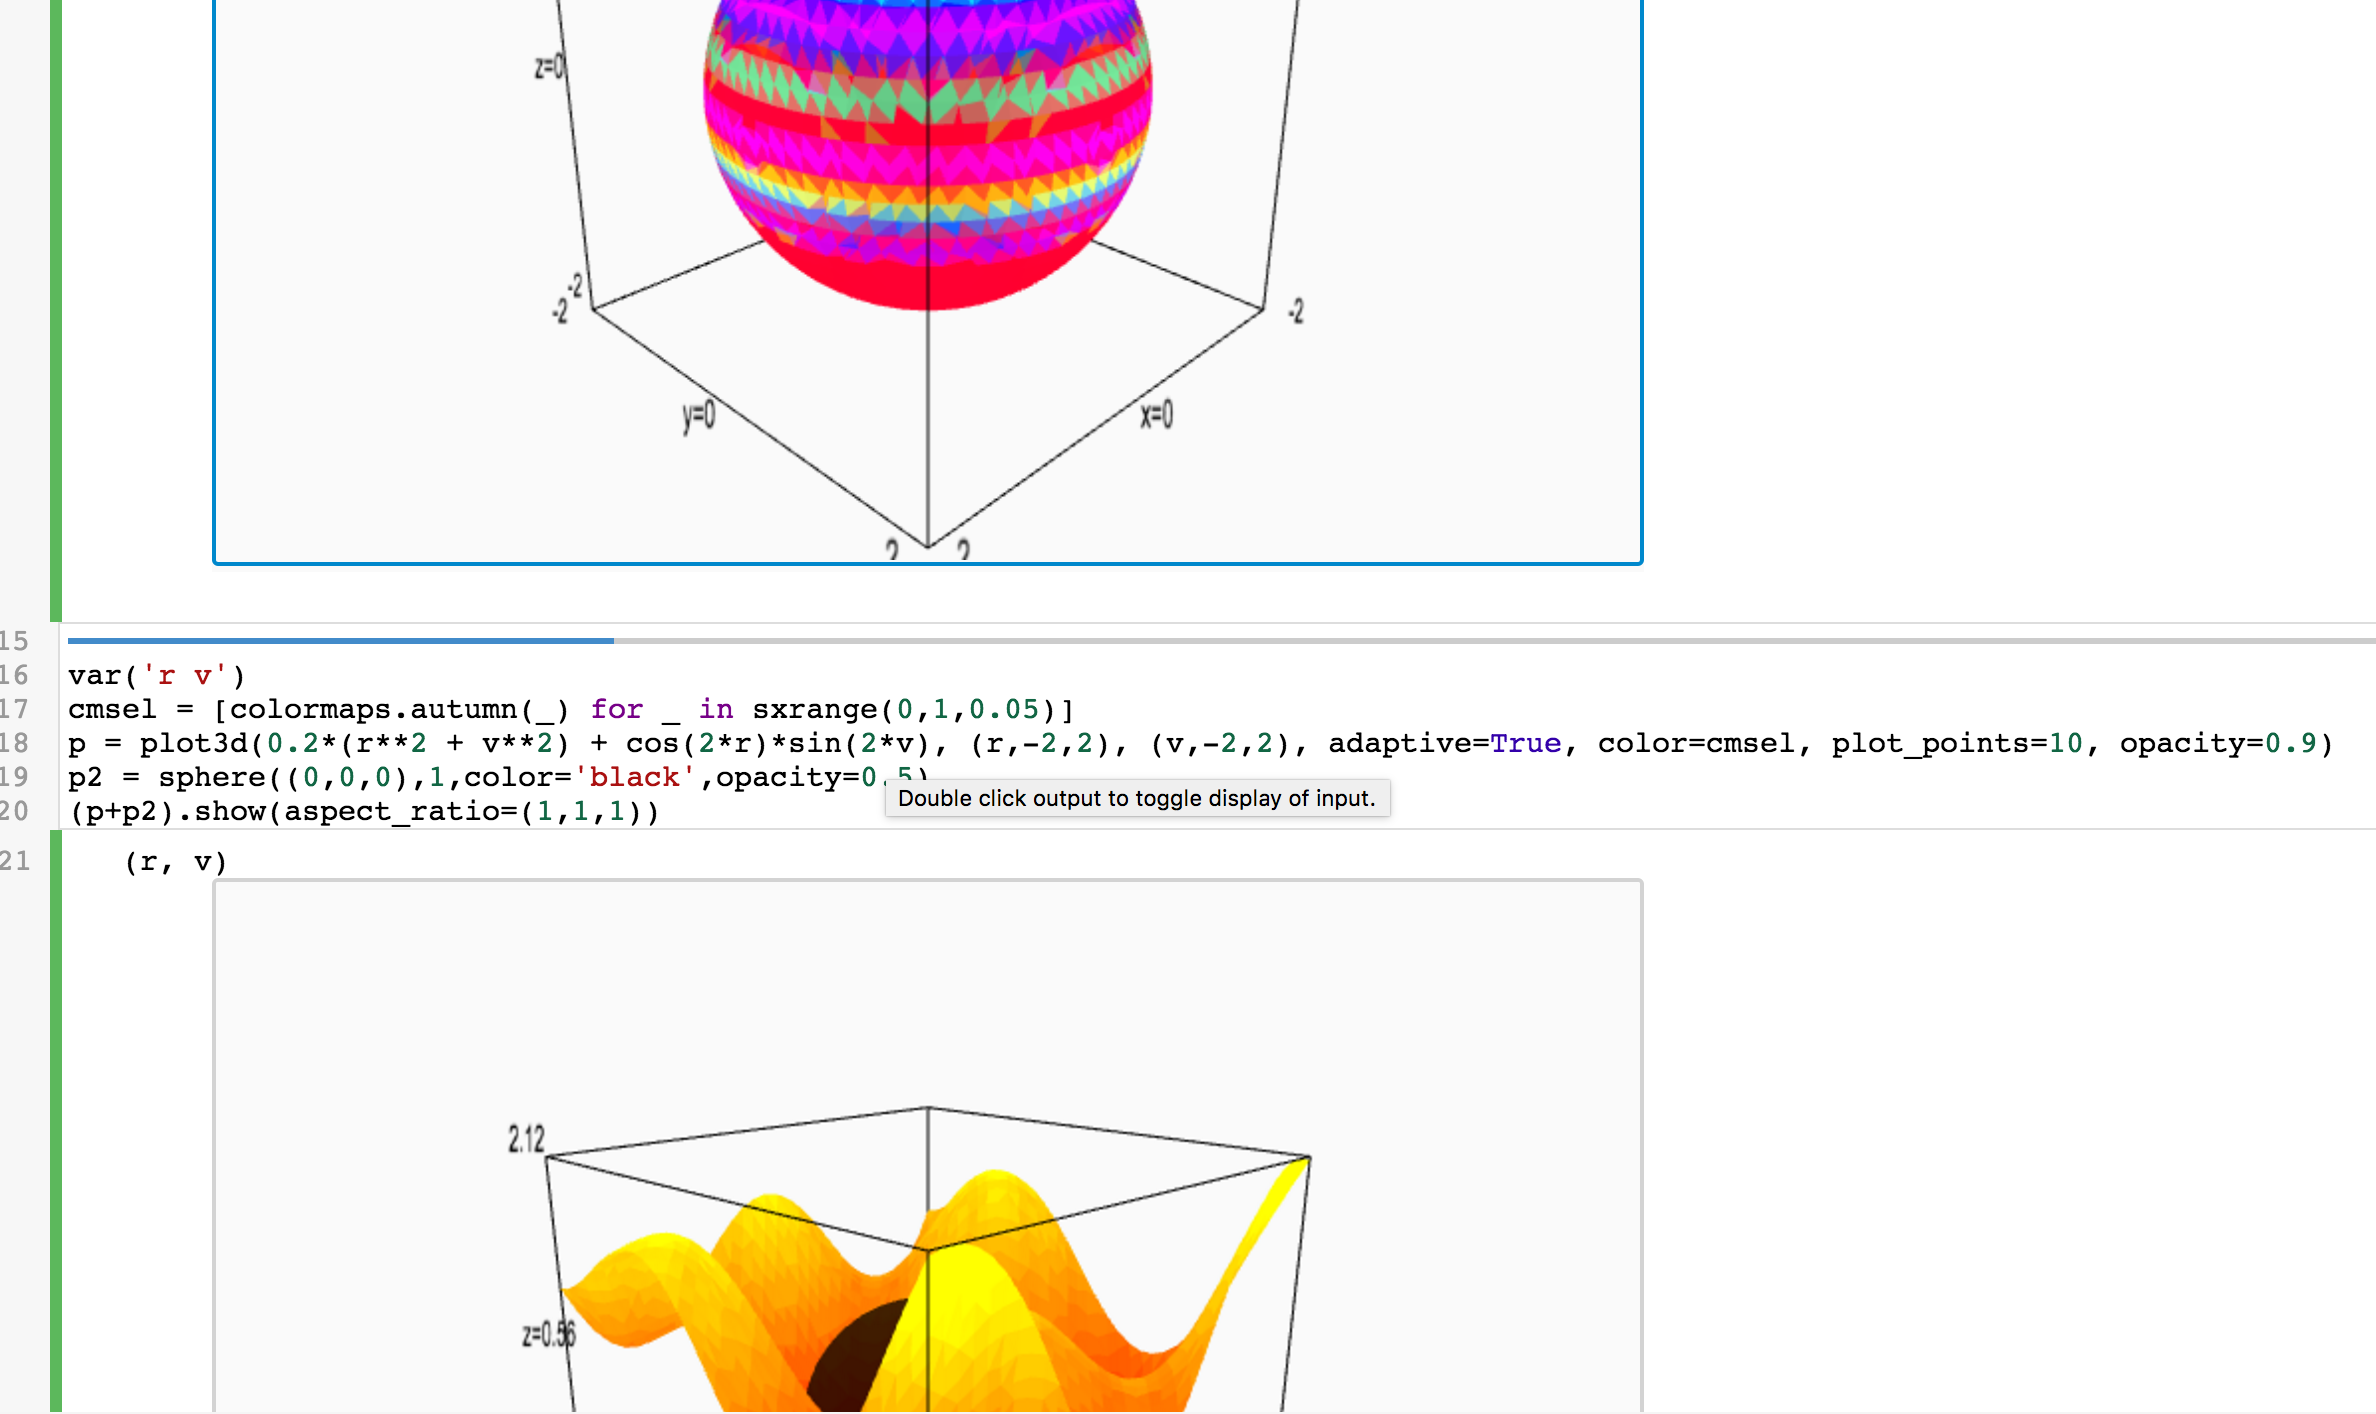
cmsel = [colormaps.autumn(_) for _ in sxrange(0,1,0.05)]
var('r,t')
S=parametric_plot3d([2*r*cos(t), sqrt(2)*r*sin(t), 4 + (2*r*cos(t))^2 - 2*(sqrt(2)*r*sin(t))^2], (r,0,1),(t,0,pi/2), adaptive=True, color=cmsel, plot_points=10, opacity=0.9)
What am I missing?
Thabks again,
JC
Thanks a lot. I tried the parametric plot version, which resulted in an error.
cmsel = [colormaps.autumn(_) for _ in sxrange(0,1,0.05)]
var('r,t')
S=parametric_plot3d([2*r*cos(t), sqrt(2)*r*sin(t), 4 + (2*r*cos(t))^2 - 2*(sqrt(2)*r*sin(t))^2], (r,0,1),(t,0,pi/2), adaptive=True, color=cmsel, plot_points=10, opacity=0.9)
What am I missing?
Thabks again,
JC
William Stein
Sep 21, 2016, 2:28:15 PM9/21/16
to sage-cloud, chap...@math.unistra.fr
On Tue, Sep 20, 2016 at 5:32 PM, Juan Carlos Bustamante
<jotac...@gmail.com> wrote:
> Dear William,
>
> Thanks a lot. I tried the parametric plot version, which resulted in an
> error.
I don't understand what you're doing. You're passing in an array of
<jotac...@gmail.com> wrote:
> Dear William,
>
> Thanks a lot. I tried the parametric plot version, which resulted in an
> error.
color maps as cmsel rather than a single one... Maybe F. Chapoton has
a better idea what is going on.
Juan Carlos Bustamante
May 3, 2017, 12:48:43 PM5/3/17
to sage-...@googlegroups.com
Thanks for that (old) update.
The parametric_plot3d(..) version does not work, though. Am I missing
something?
JC
The parametric_plot3d(..) version does not work, though. Am I missing
something?
JC
Juan Carlos Bustamante
May 4, 2017, 8:54:49 PM5/4/17
to sage-cloud
I got it, this worked, sorry.
JC
var('s,t')
def x(t) :
return cos(t)*(1-cos(t))
def y(t) :
return sin(t)*(1-cos(t))
def cf(s,t): return sin(s+t/3)**2
Surf = parametric_plot3d([(x(t)+x(s))/2, (y(t)+y(s))/2, sqrt((x(t)-x(s))^2 + (y(t)-y(s))^2)], (t,0,2*pi),(s,0,2*pi), adaptive = True, color=(cf,colormaps.Blues) , opacity=0.7, mesh = 0.7)
show(Surf)
Reply all
Reply to author
Forward
0 new messages