Unattended plotting
344 views
Skip to first unread message

Tom Parker
Dec 11, 2016, 7:50:11 PM12/11/16
to raspber...@googlegroups.com
I wrote a small command line java app to create swarm-like plots without needing to launch swarm. The app is intended to allow plots to be created periodically by cron or the Windows task scheduler. This is an early tester version and has little polish, however basic functionality seems to work. Currently you can specify the size of the plot and the time span, but
many other options are still hard coded. Over time a few more display and data
processing options will be supported.
While my day gig involves writing code for USGS, I have done this on my own time building on publicly available code. I'm still adding features, but I can't make any promises about how quickly work on this app will progress.
https://github.com/tparker-usgs/swarmPlotter/releases/download/V1.0.0-SNAPSHOT/swarmPlotter.jar
Some example command lines and resulting plots are below. The commands use relative times to produce plots of current data, however a specific time span can also be provided in yyyyMMddHHmm-yyyyMMddHHmm format if there's a specific time you want to plot. Each of the commands includes the station code for my shake. You'll need to replace that with your station code.
Hope this is useful to someone.
--Tom
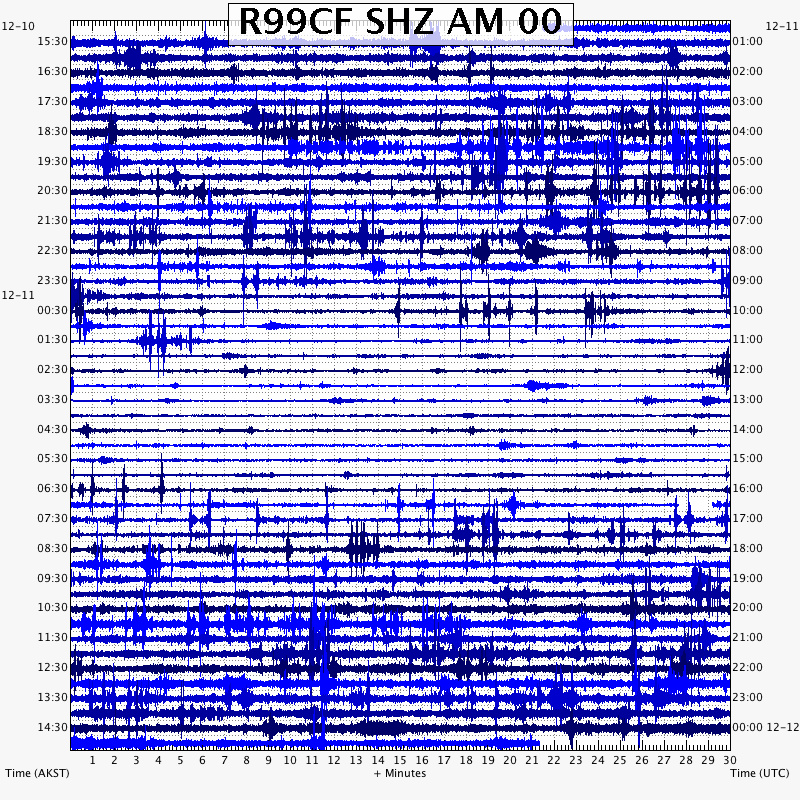
Helicorder for the past 24 hours:
java -jar swarmPlotter.jar -p heli -t -24h -c R99CF_SHZ_AM_00 -s wws:raspberryshake.local:16032 -z US/Alaska heli.png
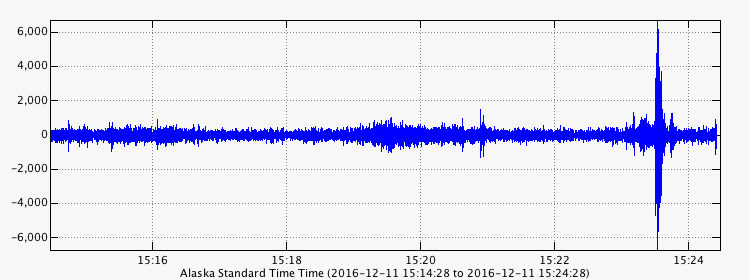
Waveform for past 10 minutes:
java -jar swarmPlotter.jar -p wave -t -10i -c R99CF_SHZ_AM_00 -s wws:raspberryshake.local:16032 -z US/Alaska wave.png
java -jar swarmPlotter.jar -p wave -t -10i -c R99CF_SHZ_AM_00 -s wws:raspberryshake.local:16032 -z US/Alaska wave.png
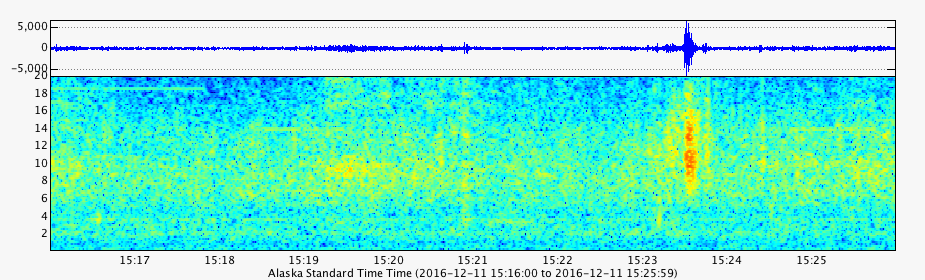
java -jar swarmPlotter.jar -p spectrogram --spectrogramWave -t -10i -c R99CF_SHZ_AM_00 -s wws:raspberryshake.local:16032 -z US/Alaska spectrogram.png
java -jar swarmPlotter.jar --help
Usage:
java -jar swarmplotter.jar [--help] (-t|--timeSpan) <timeSpan> [-v|--verbose]
[(-z|--timeZone) <timeZone>] [(-d|--dimension) <dimension>] (-p|--plotType)
<plotType> (-c|--channel) <channel> (-s|--dataSource) <dataSource>
[--heliSuppressClip] [--heliForceCenter] [(-r|--heliRowSpan) <heliRowSpan>]
[-l|--plotLabel] [--spectrogramWave] <outputFile>
I am the Swarm plotter
[--help]
Prints this help message.
(-t|--timeSpan) <timeSpan>
Time span as yyyyMMddHHmm-yyyyMMddHHmm
All times in UTC.
[-v|--verbose]
Verbose logging.
[(-z|--timeZone) <timeZone>]
Time zone. Only affects plot. All args must be given in UTC. (default:
Etc/UTC)
[(-d|--dimension) <dimension>]
dimension as heightxwidth in pixels. (example: 640x480)
Defaults:
wave: 280 x 750
heli: 800 x 800
spectrogram: 280 x 925
(-p|--plotType) <plotType>
One of: heli, wave, spectrogram
(-c|--channel) <channel>
channel as S_C_N_L
(-s|--dataSource) <dataSource>
Seismic data source.
[--heliSuppressClip]
Do not highlight clipping on helicorder.
[--heliForceCenter]
Force center helicorder rows.
[(-r|--heliRowSpan) <heliRowSpan>]
Length of heli row in minutes
(default: 30)
[-l|--plotLabel]
Label helicorder plot.
[--spectrogramWave]
Plot waveform above spectrogram.
<outputFile>
Output file name

Angel Rodriguez
Dec 11, 2016, 7:55:29 PM12/11/16
to raspber...@googlegroups.com
Tom,
This is great, thank you!
Angel
Shake forum on google.groupsSome useful links:
Manual: http://manual.raspberryshake.org/
Shop: https://shop.raspberryshake.org/
Website: http://raspberryshake.org/
Do It YourSelf Page: http://raspberryshake.org/do-it-yourself
--
Some useful links:
Manual: http://manual.raspberryshake.org/
Shop: https://shop.raspberryshake.org/
Website: http://raspberryshake.org/
Do It YourSelf Page: http://raspberryshake.org/do-it-yourself
---
You received this message because you are subscribed to the Google Groups "RaspberryShake" group.
To unsubscribe from this group and stop receiving emails from it, send an email to raspberryshake+unsubscribe@googlegroups.com.
To post to this group, send email to raspberryshake@googlegroups.com.
Visit this group at https://groups.google.com/group/raspberryshake.
To view this discussion on the web visit https://groups.google.com/d/msgid/raspberryshake/CACKyVhTtLEA%2BHe-c58F1XLXA2YmXg%3Dzuhpp8HP08QGPwfuo_iA%40mail.gmail.com.
For more options, visit https://groups.google.com/d/optout.

Alan Pointing
Jul 10, 2017, 2:45:23 PM7/10/17
to RaspberryShake
Hi Tom,
Your tester works really well. It also works with the new historical data source for Shake data at caps.raspberryshakedata.com
It would be very useful if you can write another command line java app to output the waveform to a mini-seed file, instead of plotting it to image file (similar arguments apart from the helicorder stuff). I have tried various seismic utilities (e.g. Obspy, ObspyDMT, GIZMO/Octave) and haven't been able to extract the historical data from caps.raspberryshakedata.com
Would really appreciate your help on this.
thanks, Alan
Reply all
Reply to author
Forward
0 new messages