Publishing raspberry shake output on a personal web page

Gerard
There have been various conversations about publishing raspberry shake output on personal web pages. There have been some really good suggestions about the use of the obspy python software. This is obviously a powerful toolkit which I think is especially useful if your web page is being hosted locally. I thought I would share another approach which I have been working on.
I should acknowledge up front, that my approach has been largely inspired by the fantastic Android EQInfo App. I bought cheap Android tablet specifically so I could use this application. It is well designed and has some great features. I live in a geologically quiet location (Brisbane Australia ). So the most likely seismic activity I can pick up, above background noise, is related to large overseas quakes. For that reason there is not much point displaying a continuous feed. It is most interesting to look at when it has picked up a large OS quake.
You can view my site at: http://greenbridge.net.au/quakes.php. It is part of a small site which publishes weather information recorded at home.
As you can see it is built in PHP. The quakes page has two panels. The left panel lists quakes recorded in the last 60 days which, based on their location and magnitude, are likely to have being picked up by my Raspberry Shake. This is using the US Geological Survey FDSN restful web services feed. I am using CURL to fetch all recent recordings worldwide with a magnitude > 5. I am storing this in a mysql db and using a mysql query with appropriate filters to select the quakes that I think may show up at home.
The right panel uses the raspberry shake FDSN web service to fetch the recording from the raspberryshake FDSN server. (For details see http://manual.raspberryshake.org/traces.html#tools4programmers).
To fetch and display the seismic record I am using the javascript library published on github by Philip Crotwell. (I was quite delighted when I found this library, even more delighted when I got it to work). https://github.com/crotwell/seisplotjs-waveformplot. (Might be useful to add this to the tools4programmers section of the user guide)
To keep things simple, I have used a bit of a shortcut to calculate the time of arrival. (apologies to professionals who may consider my approach a bit of a hack).
I used a commonly available table which sets angular distance against time of arrival for the P wave. I then used Excel to get a best fit equation for the curve (I used a third order polynomial which had a R^2 value of 0.9997).
To fetch the correct time window I first calculate the angular distance between the earthquake location and my location. I then use the equation to calculate the expected time of arrival. I add a 60 second offset and display a 10 minute window. (So there is no theoretical foundation to the equation - but it is easier then doing a lookup which seems to be what other sites work on).
To illustrate how easy it is to use the JS library. The following snippet is dyamically added to the page when a quake is selected (and then the JS called):
<div class='myseisplot' net='AM' sta='R9A9D' loc='00' chan='SHZ' duration='600' host='fdsnws.raspberryshakedata.com' start='$start'></div>
(where $start is the start date / time for the plot)
There is obviously a lot of things that could be done with this site. I would love to be able to apply a frequency filter to the output, but haven't had a chance to investigate options for doing this. My site is hosted by an ISP that supports PHP, but I don't think they support python. Hence one of the drivers for taking the approach I have. I think the way I call the JS function is a bit clumsy and could be a lot more elegant.
My code is a bit rough, but I am happy to share any of it if anybody is interested. Thanks again to the Raspberry Shake team at OSOP and gempa GmbH. Thanks also to Philip Crotwell for publishing his JS library and making it available for use.
Gerard

Branden Christensen
To fetch and display the seismic record I am using the javascript library published on github by Philip Crotwell. (I was quite delighted when I found this library, even more delighted when I got it to work). https://github.com/crotwell/seisplotjs-waveformplot. (Might be useful to add this to the tools4programmers section of the user guide)
There is obviously a lot of things that could be done with this site. I would love to be able to apply a frequency filter to the output, but haven't had a chance to investigate options for doing this. My site is hosted by an ISP that supports PHP, but I don't think they support python. Hence one of the drivers for taking the approach I have. I think the way I call the JS function is a bit clumsy and could be a lot more elegant.
My code is a bit rough, but I am happy to share any of it if anybody is interested. Thanks again to the Raspberry Shake team at OSOP and gempa GmbH. Thanks also to Philip Crotwell for publishing his JS library and making it available for use.

Tim Grimes

paul denton
Gerard
I have zipped up the relevant parts of my site. I tried to add the zip file here, but google didn't want to load it.
Instead, I have added it as a download on my links page: http://greenbridge.net.au/links.php
I would love to see what you decide to do with it. Good luck.
Gerard
Gerard
Thanks for the feedback and thanks for the advice on using the IRIS web service to fetch travel times. I wasn't aware this was available. Would have been a lot faster journey!
Regards
Gerard

Philip Crotwell
Hi
Glad to hear my code is useful. While using the seisplotjs-waveformplot
directly as you have is likely the easiest, you may wish to use seisplotjs,
which is a umbrella project that pulls in seisplotjs-waveformplot plus lots
of other useful things and so would be easier if you want to do more
advanced things like filtering within your own javascript code.
https://github.com/crotwell/seisplotjs
Also included in this (and available separately) is seisplotjs-filter for
basic waveform filtering, and seisplotjs-traveltime that queries the IRIS
traveltime web service (which internally uses my java travel time
calculator, TauP) as well as seisplotjs-distaz which will do the spherical
distance calculations without a web call and seisplotjs-fdsnevent that
queries a web service for event parameters. There are others as well, so
anything in my github that starts with "seisplotjs-" is (or will be) part
of this. Here are a bunch of links for your clicking pleasure...
https://github.com/crotwell/seisplotjs-filter
https://github.com/crotwell/seisplotjs-traveltime
https://github.com/crotwell/seisplotjs-distaz
https://github.com/crotwell/seisplotjs-fdsnevent
Also some of the examples that may be useful are here. This should be the
same as the corresponding github code, just with the dependencies and so
runnable:
http://www.seis.sc.edu/~crotwell/seisplotjs_demo
All free for reuse, but under active development so expect missing
documentation, wrong examples and probably lots of changes as I improve it,
:) but I hope it will be useful. The goal is to eventually be able to do
basic seismic data processing in the browser without relying on any
server-side coding.
Comments welcome.
thanks
Philip

Ben Orchard
Cheers.

TideMan
I could not get my browserify to work properly, so I tried your bundle.js and it works!!
Now I can have fun configuring a webpage that will display any instrument for any date.
Cheers
Derek

Graham
I am struggling to get this to work - how to I create the sql tables that are required on my website
Thanks
Graham
Gerard
Your ISP will need to support both PHP and MySQL. You could use some other relational database (eg. Postgres) but the syntax of my code was designed to work with MySQL.
If you have access to both PHP and MySQL, then you could install phpmyadmin. Depending on how you installed your web server in your local environment, this may already be in your stack. (I had to install it locally, but my ISP uses cPanel as the web admin tool and this includes phpmyadmin). In which case you can run the CREATE TABLE sql script which is included in my set of files that I zipped (create-tblshakes.sql). There is only one table required.
I noticed after writing this code that the function I am using to escape parameters before including in the SQL statements: mysql_escape_string() has been deprecated in later versions of PHP. This may cause problems depending on your PHP version. Rather then escaping parameters and parsing into the SQL statement the recommended approach these days is to use PREPARE statements. I am afraid I am a bit of a dinosaur and haven't managed to update myself (or my code). I do need to update my code, but I am back at work now from my holidays, and I am not sure when that is likely to happen.
You could also skip the database component all together, and just display the list of events fetched from the FDSN web service, without saving it to the local DB. The main advantage of saving the events locally was that it was easy to then craft and experiment with a SQL WHERE clause to fetch the records I wanted to display. I also had in mind that in future I might also store the trace against each event to avoid constant calls to the web service. However, given you are struggling with making sql work, this may be a good approach.
Gerard
Tim Grimes
Gerard
You have a great site with a lot of data. The site seems to work OK in Microsoft Edge. However there seems to be a script error in IE11 (Developer Mode > Console) (on my site as well).
SCRIPT438: : Object doesn't support property or method 'endsWith'
I am not in a position to follow this up tonight. However, dropping that error into google does seem to come up with some hopeful leads. IE11 is obviously triggering a JS error, so it might be in the seisplotjs-waveformplot library.
Let us know how you go.
Gerard
Graham
Have you got this working on Windows 10
I am having great trouble trying to get this to work - Gerard has been absolutely brilliant with his help but I still cant get it to work
I get the following errors
Notice: Trying to get property of non-object in C:\Tools\wamp64\www\earthquakes\quakes.php
on line 60
Warning: Invalid argument supplied for foreach() in C:\Tools\wamp64\www\earthquakes\quakes.php
on line 60
Warning: mysql_fetch_array() expects parameter 1 to be resource, boolean
given in C:\Tools\wamp64\www\earthquakes\quakes.php on line 117
Notice: Undefined variable: id in C:\Tools\wamp64\www\earthquakes\quakes.php
on line 145
Is there any chance you could send me your php files
Regards
Graham
Philip Crotwell
I do not use IE, so not sure if this will fix all of your issues, but
I think adding this polyfill will take care of at least the "endsWith"
error. Just add this before any other <script> tags so it executes
first.
<script src="https://cdnjs.cloudflare.com/ajax/libs/babel-polyfill/6.26.0/polyfill.min.js"></script>
More info is here:
https://babeljs.io/docs/usage/polyfill
and here:
https://developer.mozilla.org/en-US/docs/Web/JavaScript/Reference/Global_Objects/String/endsWith
where down at the bottom it says that IE doesn't support this functions.
I will look into how best to include this is seisplotjs when I get a chance.
Philip
> Some useful links:
>
> Manual: http://manual.raspberryshake.org/
> Do It YourSelf Page: http://raspberryshake.org/do-it-yourself
> Shop: https://shop.raspberryshake.org/
> Website: http://raspberryshake.org/
>
> Instagram: https://www.instagram.com/raspishake/
> Facebook: https://www.facebook.com/raspishake/
> Twitter: https://twitter.com/raspishake/
> Hashtag: #rasperryshake
> ---
> You received this message because you are subscribed to a topic in the
> Google Groups "RaspberryShake" group.
> To unsubscribe from this topic, visit
> https://groups.google.com/d/topic/raspberryshake/Iv21zaknLnw/unsubscribe.
> To unsubscribe from this group and all its topics, send an email to
> raspberryshak...@googlegroups.com.
> To post to this group, send email to raspber...@googlegroups.com.
> Visit this group at https://groups.google.com/group/raspberryshake.
> To view this discussion on the web visit
> https://groups.google.com/d/msgid/raspberryshake/55908039-4d85-41d8-8d81-e2c294efbb0f%40googlegroups.com.
>
> For more options, visit https://groups.google.com/d/optout.
Tim Grimes
Tim Grimes
Gerard
Gerard

Angel Rodriguez
--
Some useful links:
Manual: http://manual.raspberryshake.org/
Do It YourSelf Page: http://raspberryshake.org/do-it-yourself
Shop: https://shop.raspberryshake.org/
Website: http://raspberryshake.org/
Instagram: https://www.instagram.com/raspishake/
Facebook: https://www.facebook.com/raspishake/
Twitter: https://twitter.com/raspishake/
Hashtag: #rasperryshake
---
You received this message because you are subscribed to the Google Groups "RaspberryShake" group.
To unsubscribe from this group and stop receiving emails from it, send an email to raspberryshake+unsubscribe@googlegroups.com.
To post to this group, send email to raspberryshake@googlegroups.com.
Visit this group at https://groups.google.com/group/raspberryshake.
To view this discussion on the web visit https://groups.google.com/d/msgid/raspberryshake/07ccfeae-d595-4d9c-bc9d-52fdb434f6e9%40googlegroups.com.
Tim Grimes
I noticed the wave form no longer shows in this script.

WMXZ
Gerard
I updated the function createPlotsBySelector() in bundle.js to hardwire the protocol to https.
In my case I changed line 21412 in bundle.js:
var protocol = 'https:';
(note that if you are building this file via browserfy/npm it may be a different line number)
And everything seemed to work OK.
Gerard
Tim Grimes

Alan Pointing
Hi,
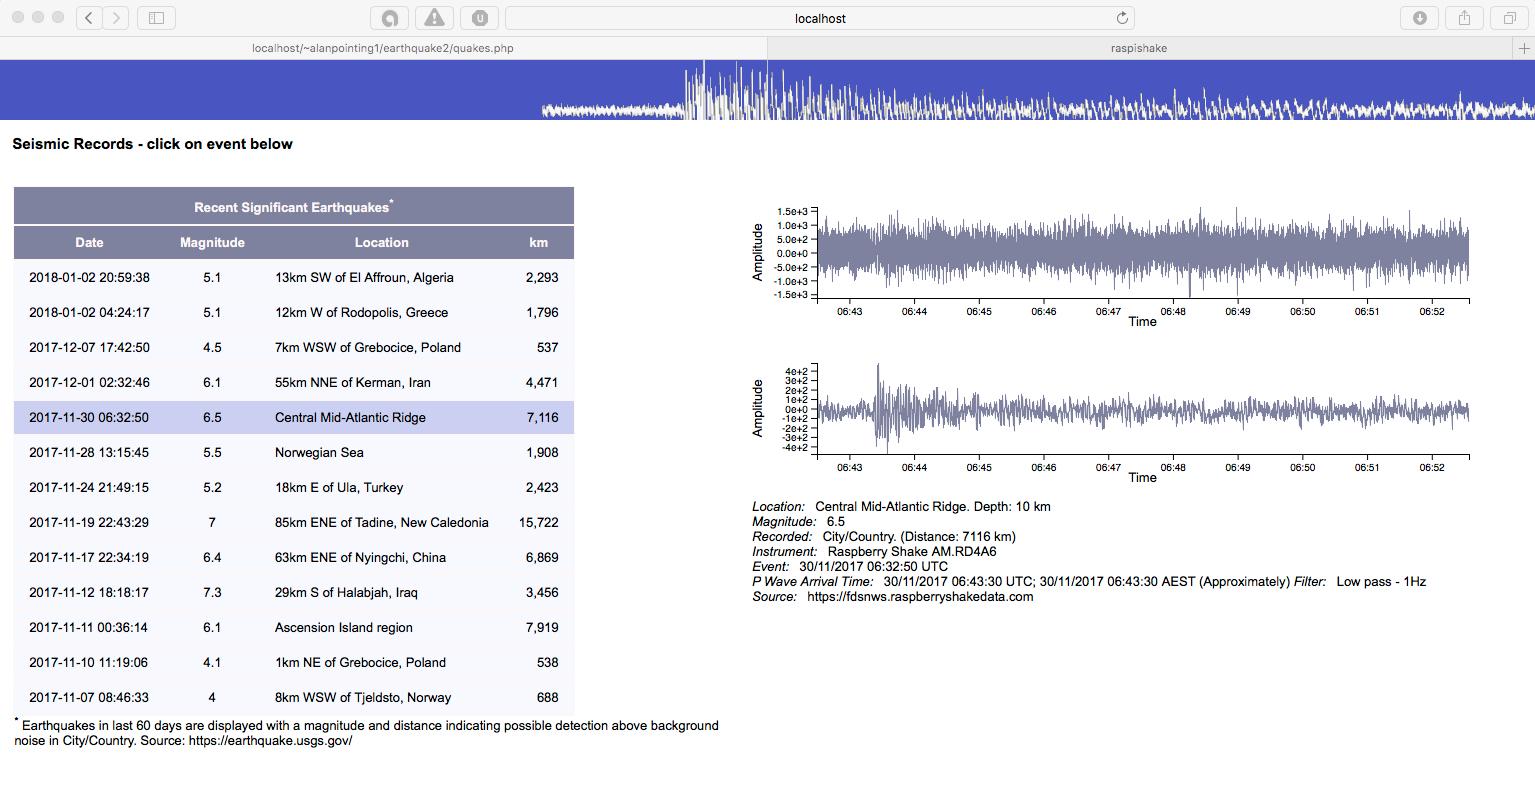
Being in an intra-plate area, most of the earthquakes I can detect on my Raspberry Shake are regional and teleseismic events, hence a filtered waveform is important to remove cultural noise.
With this in mind, I have modified the code for Gerard’s personal webpage, to show a filtered waveform underneath the raw waveform. The filter uses the code that Philip Crotwell describes in this post.
For example the attached screen shot shows a 6.5 event that can't be identified on the raw waveform, but can be seen on the filtered waveform.
I have uploaded the instructions to update Gerard’s and Philip’s code to the github site:
https://github.com/raspishake/plot_filtered_waveform_on_personal_website
I am not a programmer, so the modifications might not be very elegant, but it seems to work. Thanks to Gerard and Philip for providing the base code.
Regards, Alan
Branden Christensen
--
Some useful links:
Manual: http://manual.raspberryshake.org/
Do It YourSelf Page: http://raspberryshake.org/do-it-yourself
Shop: https://shop.raspberryshake.org/
Website: http://raspberryshake.org/
Instagram: https://www.instagram.com/raspishake/
Facebook: https://www.facebook.com/raspishake/
Twitter: https://twitter.com/raspishake/
Hashtag: #rasperryshake, @raspishake
DOI: https://doi.org/10.7914/SN/AM
---
You received this message because you are subscribed to the Google Groups "RaspberryShake" group.
To unsubscribe from this group and stop receiving emails from it, send an email to raspberryshake+unsubscribe@googlegroups.com.
To post to this group, send email to raspberryshake@googlegroups.com.
Visit this group at https://groups.google.com/group/raspberryshake.
To view this discussion on the web visit https://groups.google.com/d/msgid/raspberryshake/ea085dbf-eaf9-499c-9947-d13359673323%40googlegroups.com.
Gerard
Gerard

endumen
To fetch and display the seismic record I am using the javascript library published on github by Philip Crotwell. (I was quite delighted when I found this library, even more delighted when I got it to work). https://github.com/crotwell/seisplotjs-waveformplot. (Might be useful to add this to the tools4programmers section of the user guide)
endumen
endumen
Branden Christensen
--
Some useful links:
Manual: http://manual.raspberryshake.org/
Do It YourSelf Page: http://raspberryshake.org/do-it-yourself
Shop: https://shop.raspberryshake.org/
Website: http://raspberryshake.org/
Instagram: https://www.instagram.com/raspishake/
Facebook: https://www.facebook.com/raspishake/
Twitter: https://twitter.com/raspishake/
Hashtag: #rasperryshake, @raspishake
DOI: https://doi.org/10.7914/SN/AM
---
You received this message because you are subscribed to the Google Groups "RaspberryShake" group.
To unsubscribe from this group and stop receiving emails from it, send an email to raspberryshake+unsubscribe@googlegroups.com.
To post to this group, send email to raspberryshake@googlegroups.com.
Visit this group at https://groups.google.com/group/raspberryshake.
To view this discussion on the web visit https://groups.google.com/d/msgid/raspberryshake/98c06bb4-305d-4c3e-b50d-50a825520311%40googlegroups.com.
Philip Crotwell
http://www.seis.sc.edu/~crotwell/NetOps2018/Demo/demo_fdsnstation.html
--
Some useful links:
Manual: http://manual.raspberryshake.org/
Do It YourSelf Page: http://raspberryshake.org/do-it-yourself
Shop: https://shop.raspberryshake.org/
Website: http://raspberryshake.org/
Instagram: https://www.instagram.com/raspishake/
Facebook: https://www.facebook.com/raspishake/
Twitter: https://twitter.com/raspishake/
Hashtag: #rasperryshake, @raspishake
DOI: https://doi.org/10.7914/SN/AM
---
You received this message because you are subscribed to a topic in the Google Groups "RaspberryShake" group.
To unsubscribe from this topic, visit https://groups.google.com/d/topic/raspberryshake/Iv21zaknLnw/unsubscribe.
To unsubscribe from this group and all its topics, send an email to raspberryshake+unsubscribe@googlegroups.com.
To post to this group, send email to raspberryshake@googlegroups.com.
Visit this group at https://groups.google.com/group/raspberryshake.
To view this discussion on the web visit https://groups.google.com/d/msgid/raspberryshake/7b069ac4-41d5-4098-bb9e-fa35702809c8%40googlegroups.com.