prediction numerical issues
137 views
Skip to first unread message

Sylvan Benaksas
May 11, 2022, 5:11:09 AM5/11/22
to R-inla discussion group
Hi there,
For a paper studying the spatio temporal distributions of fish biomass from fishery survey data I have almost finished developing my model using a tweedie distribution. Finn recently pointed out that I was not applying the spde object correctly to my prediction stack. Having fixed that the predicted values do not make sense (going up to 600,000 instead of ~ 0-2000). Can anyone offer some advice as to what is going wrong, potentially the model is too complex and this is a numerical issue?
I'm not sure, I can send code and data if anyone would like to have a look,
Best wishes,
Sylvan Benaksas
Sylvan Benaksas
May 18, 2022, 5:05:00 AM5/18/22
to R-inla discussion group
Hi,
Would anyone have any advice on my numerical issues?
Much appreciated,
Sylvan

Finn Lindgren
May 18, 2022, 6:46:39 AM5/18/22
to Sylvan Benaksas, R-inla discussion group
Have you plotted the posterior medians against the observations? Due
to the exponential transformation, if the uncertainty/variability is
overestimated, that can have a large effect on the posterior means,
but less so on the medians.
That may help troubleshoot the issue.
Finn
> --
> You received this message because you are subscribed to the Google Groups "R-inla discussion group" group.
> To unsubscribe from this group and stop receiving emails from it, send an email to r-inla-discussion...@googlegroups.com.
> To view this discussion on the web, visit https://groups.google.com/d/msgid/r-inla-discussion-group/71c6a40b-1d08-48d4-af97-aa3d60e68b0an%40googlegroups.com.
--
Finn Lindgren
email: finn.l...@gmail.com
to the exponential transformation, if the uncertainty/variability is
overestimated, that can have a large effect on the posterior means,
but less so on the medians.
That may help troubleshoot the issue.
Finn
> You received this message because you are subscribed to the Google Groups "R-inla discussion group" group.
> To unsubscribe from this group and stop receiving emails from it, send an email to r-inla-discussion...@googlegroups.com.
> To view this discussion on the web, visit https://groups.google.com/d/msgid/r-inla-discussion-group/71c6a40b-1d08-48d4-af97-aa3d60e68b0an%40googlegroups.com.
--
Finn Lindgren
email: finn.l...@gmail.com
Sylvan Benaksas
May 18, 2022, 10:24:13 AM5/18/22
to R-inla discussion group
Hi Finn,
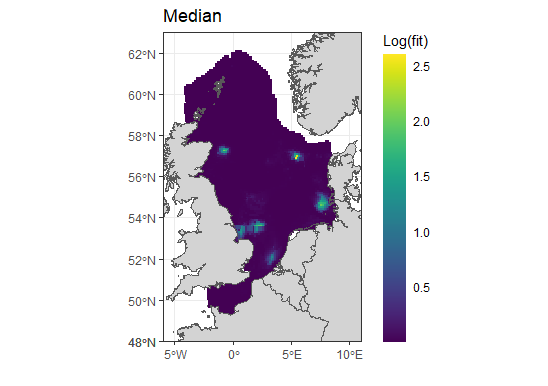
The median values seem to be less extreme, but the distribution does not look right, it looks like the spde effect has not been applied to them? The sd is massive so not sure what has gone wrong here.
here is a glimpse at the posterior outout
ind.predz<-inla.stack.index(pred.stack.z, tag="pred.z")$data
options(scipen=999)
biom3<-tweed_pred_sub$summary.fitted.values[ind.predz,]
options(scipen=999)
biom3<-tweed_pred_sub$summary.fitted.values[ind.predz,]
head(biom3)
mean sd 0.025quant 0.5quant 0.975quant mode
fitted.APredictor.055148 27811.47 897572.8 4.868382 861.2646 151731.98 0.8354602
fitted.APredictor.055238 27740.95 575728.7 10.596442 1335.0292 167543.98 3.1272065
fitted.APredictor.055251 26417.46 607308.9 8.405452 1147.9712 156163.68 2.1836079
fitted.APredictor.070433 20161.82 596731.1 4.105785 680.7702 112412.91 0.7841879
fitted.APredictor.055264 17645.45 642983.3 2.501620 484.0253 93254.97 0.3663405
fitted.APredictor.070404 17186.70 711205.4 1.956681 415.1710 87711.99 0.2446277
Cheers,
Sylvan
Finn Lindgren
May 18, 2022, 10:47:32 AM5/18/22
to R-inla discussion group
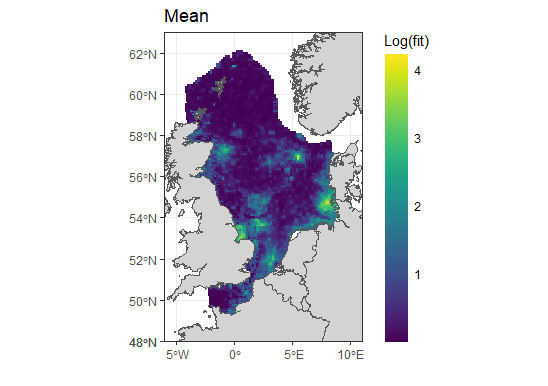
The 4 in the second plot corresponds to exp(4) which is around 55, not ~20000. Does your predictor include points outside the region of interest, that are therefore not shown in the plot (and also not an issue; spatial extrapolation from a model like this is likely not reliable, so those values should be ignored)?
I don't see any extreme values in the plots. Where are the ~20000 and ~600000 values located?
Finn
To view this discussion on the web, visit https://groups.google.com/d/msgid/r-inla-discussion-group/5ca0375b-651b-4408-b2cb-d427673d86a5n%40googlegroups.com.
Sylvan Benaksas
May 18, 2022, 11:29:10 AM5/18/22
to Finn Lindgren, R-inla discussion group
Hi Finn,
Sorry the labels are wrong. I am using log base 10 for the plots, so that would give > 10 on regular log scale not 4. there are no points outside the region, all are being shown.
Thanks again,
Sylvan
You received this message because you are subscribed to a topic in the Google Groups "R-inla discussion group" group.
To unsubscribe from this topic, visit https://groups.google.com/d/topic/r-inla-discussion-group/10KHypf3Vdk/unsubscribe.
To unsubscribe from this group and all its topics, send an email to r-inla-discussion...@googlegroups.com.
To view this discussion on the web, visit https://groups.google.com/d/msgid/r-inla-discussion-group/CAHC4gzY9BgKaiG4faMPmsQbrjTSsXGps0AOkP%3DQpVTkC%2B6bOZQ%40mail.gmail.com.
Finn Lindgren
May 18, 2022, 11:44:43 AM5/18/22
to R-inla discussion group
I see.
But that still only takes the values up to ~10,000, not 600,000.
However, the quantiles are likely much more relevant; the medians look like they are actually in the reasonable range (10^2.5 is ~316), and the partial predictor table has values in the range 400 to 1300 (indicating the plot doesn't show the full range somehow, since log10(1300) is greater than 3, and the scale cuts off before that!)
So the real issue seems to be the uncertainty, which gives a huge range in the lower&upper quantiles, and large sd. If one had the mean&sd on the log scale, then the exponentiated mean would be exp(m+s^2/2) if the log-scale posterior is Normal, so the large uncertainty on the log-scale is what leads to the large posterior means.
So to troubleshoot it, I'd investigate what's causing the large uncertainty. E.g. how identifiable should one expect the model to be? What does the summary.fixed output look like? Is the spde confounded with a global intercept, for example? Even though their sum should be identifiable, I'm not sure how well the Tweedie distribution works in practice; it's not a simple model!
What happens if you use something simpler, like a negative binomial, or even a Poisson, to see how those simpler observation models behave in combination with your predictor model?
Finn
Finn Lindgren
May 18, 2022, 11:53:58 AM5/18/22
to R-inla discussion group
Based on your prediction table, a mean of 25000 corresponds to a median of 1000, so assuming a normal posterior on the log-scale (so that the log-scale mean and median are the same), we get
exp(log(1000) + s^2/2) = 25000, where s is the posterior std.dev on the log-scale.
That gives
s = sqrt(2*log(25000/1000)) = 2.54 and log(1000) = 6.9 as the the log-scale median (and mean)
These look like quite reasonable values on their own, but it shows that 2.54 is quite a large standard deviation on the log-scale.
So one place to look for problems is in how you choose your prior distributions for standard deviations and precisions!
Also check all the estimated hyperparameters.
Finn
Sylvan Benaksas
May 20, 2022, 5:38:49 AM5/20/22
to R-inla discussion group
Hi Finn,
Cheers,
Thanks a lot for all the advice! I think I may have fixed the issue, it was to do with the spde matern priors. By changing them from:
spde2<-inla.spde2.pcmatern(mesh,
prior.range = c(300,0.05),
prior.sigma = c(0.5,0.05))
prior.range = c(300,0.05),
prior.sigma = c(0.5,0.05))
to
spde2<-inla.spde2.pcmatern(mesh,
prior.range = c(150,0.01),
prior.sigma = c(0.05,0.01))
prior.range = c(150,0.01),
prior.sigma = c(0.05,0.01))
The model is working very well, I now receive only three lines of the following error message (previously hundreds of lines)
"GMRFLib_2order_approx: rescue NAN/INF values in logl for idx=8803"
However, I am receiving several lines of this error message instead (~10)
"dtweedie: Reached upper limit. Increase TWEEDIE_MAX_IDX or scale your data!"
My data is scaled and the model seems to run. do you think I can ignore this
Sylvan
Finn Lindgren
May 20, 2022, 6:38:03 AM5/20/22
to Sylvan Benaksas, R-inla discussion group
For the data scaling, it might be that it's not scaled "enough"...
Tweedie is a very difficult model to work with.
Finn
To view this discussion on the web, visit https://groups.google.com/d/msgid/r-inla-discussion-group/be54d0db-afba-4e9b-8bb3-17f1560bc7fen%40googlegroups.com.
Sylvan Benaksas
May 26, 2022, 11:33:03 AM5/26/22
to R-inla discussion group
Hi Finn,
Thanks again for the advice. I was still having issues after fixing the spde priors. The two RW2 non-linear effects were causing issues and I think the scale warning. I also had 3 factor variables included as iid random effects which were also causing issues (massive SD). I removed both of these issues and the model is working. I would like to include two of the factor variables; I have managed to included one as a 0/1 dummy variable but the other causes issues showing more than usual of the warning below where the model gets stuck and freezes.
GMRFLib_2order_approx: rescue NAN/INF values in logl for idx=7980
Sylvan

Helpdesk
May 27, 2022, 12:28:05 AM5/27/22
to Sylvan Benaksas, R-inla discussion group
it should not 'freeze' ... ????
can you send for me to rerun?
> > > > > > > 79f88243-054a-4fca-b736-ad63235bf4f3.png
Håvard Rue
he...@r-inla.org
can you send for me to rerun?
he...@r-inla.org
Sylvan Benaksas
May 27, 2022, 5:50:20 AM5/27/22
to R-inla discussion group
Hi
Håvard,
I have fixed the issue. The problem was my dummy 0/1 variables were set as factors and not numeric.
Thanks,
Sylvan
Reply all
Reply to author
Forward
0 new messages