pycoast problems with OPC charts
44 views
Skip to first unread message

lobsiger...@gmail.com
Mar 6, 2022, 7:04:39 AM3/6/22
to pytroll
Dear Developers
Dear All
I made a bash script that downloads, heavily reworks and optimizes the NOAA OPC Atlantic and Pacific surface pressure charts. The result is four 80° degrees wide Mercator charts to overlay with Meteosat11, GOES16, GOES17 and Himawari8.
I attach the respective areas.yaml. The area definitions can be expressed with identical area_extent only changeing the central meridian. When I use coastlines these often scratch horizontally all over the place. The findings are these:
Meteosat11, Atlantic East, opcae, central meridian lon_0=-30° only ONE horizontal scratch?!
GOES16, Atlantic West, opcaw, central meridian lon_0=-60° NO HORIZONTAL SCRATCH SEEN !!
GOES17, Pacific East, opcpe, central meridian lon_0=-155° many horizontal scratch lines
Himawari8, Pacific West, opcpw, central meridian lon_0=+175° many horizontal scratch lines
One hint that could help to find the solution of the problem is this: When I change the central meridian of opcpw to lon_0=40° and shift the area_extent accordingly, I get only ONE horizontal line very similar to the opcae case.
I had a look at the code of pycoast but this goes over my head. On the other hand it seems to me that a Mercator projection with longitude as x coordinate and not including polar regions should be one of the easier cases to handle the borders of the plot. I think a possible crude workaround could be implemented by simply lifting the pen when coast segments to be plotted are unexpectedly long. But of course that's no real solution of the problem.
I wonder whether there is a problem with the bounding boxes of the shape files of GSHHG with longitudes (around +/-180°) incompatible with pycoast. I don't expect that though. Maybe using the basic symmetrical area_extent and simply stepping lon_0 from -180° to +180° in 10° steps could give more insight? Any better ideas?
Best Regards,
Ernst
# Name Version Build Channel
satpy 0.30.1 pyhd8ed1ab_0 conda-forge
pycoast 1.4.0 pyh9f0ad1d_0 conda-forge
aeas.yaml
#
# These overlays are heavily reworked and cropped versions of the Ocean Prediction Center (OPC) files
# A_sfc_full_ocean_color.png and P_sfc_full_ocean_color.png. Do not take them for OPC available charts
# A_e_sfc_ocean_color.png, A_w_sfc_ocean_color.png, P_e_sfc__ocean_color.png, P_e_sfc_ocean_color.png.
#
opcae:
description: NOAA/OPC Atlantic East Mercator (Surface Pressure Overlay, lat_ts=0.0)
projection:
proj: merc
ellps: WGS84
lon_0: -30.0
shape:
height: 1562
width: 1776
area_extent:
lower_left_xy: [-4457000.0, 1795000.0]
upper_right_xy: [4457000.0, 9600000.0]
opcaw:
description: NOAA/OPC Atlantic West Mercator (Surface Pressure Overlay, lat_ts=0.0)
projection:
proj: merc
ellps: WGS84
lon_0: -60.0
shape:
height: 1562
width: 1776
area_extent:
lower_left_xy: [-4457000.0, 1795000.0]
upper_right_xy: [4457000.0, 9600000.0]
opcpe:
description: NOAA/OPC Pacific East Mercator (Surface Pressure Overlay, lat_ts=0.0)
projection:
proj: merc
ellps: WGS84
lon_0: -155.0
shape:
height: 1562
width: 1776
area_extent:
lower_left_xy: [-4457000.0, 1795000.0]
upper_right_xy: [4457000.0, 9600000.0]
opcpw:
description: NOAA/OPC Pacific West Mercator (Surface Pressure Overlay, lat_ts=0.0)
projection:
proj: merc
ellps: WGS84
lon_0: 175.0
shape:
height: 1562
width: 1776
area_extent:
lower_left_xy: [-4457000.0, 1795000.0]
upper_right_xy: [4457000.0, 9600000.0]
# I tried to use different lon_0 and adjusted the area_extent accordingly:
# lon_0 = 0° does not scratch but only draws coastlines west of 180° !!??
# lon_0 = 40° does scratch one line on top, 80° one line at the bottom !!
opcpw40:
description: NOAA/OPC Pacific West Mercator (Surface Pressure Overlay, lat_ts=0.0)
projection:
proj: merc
ellps: WGS84
lon_0: 40.0
shape:
height: 1562
width: 1776
area_extent:
lower_left_xy: [10585375.0, 1795000.0]
upper_right_xy: [19499375.0, 9600000.0]
lobsiger...@gmail.com
Mar 7, 2022, 3:39:58 AM3/7/22
to pytroll
Hi All,
I found one more solution for the eastern part of the Atlantic. If I set lon_0 = 0° then the (only) horizontal scratch below Greenland is gone.
The corresponding asymmetric area definition is attached below. No chance so far in the Pacific where both charts include the date line.
Cheers,
Ernst
opcae:
description: NOAA/OPC Atlantic East Mercator (Surface Pressure Overlay, lat_ts=0.0)
projection:
proj: merc
ellps: WGS84
description: NOAA/OPC Atlantic East Mercator (Surface Pressure Overlay, lat_ts=0.0)
projection:
proj: merc
ellps: WGS84
lon_0: 0.0
shape:
height: 1562
width: 1776
area_extent:
lower_left_xy: [-7799750.0, 1795000.0]
upper_right_xy: [1114250.0, 9600000.0]
upper_right_xy: [1114250.0, 9600000.0]

David Hoese
Mar 8, 2022, 3:30:42 PM3/8/22
to pytroll
Ernst,
This is a known bug and will take a decent amount of debugging to nail down a possible solution. The related GitHub issue is here: https://github.com/pytroll/pycoast/issues/23
I know you aren't a big fan of GitHub and probably don't have an account, but if you read through that issue and think you have something to add, a comment would be appreciated. Otherwise, it will have to wait until someone has the time to fix it.
Dave
lobsiger...@gmail.com
Mar 10, 2022, 6:49:34 AM3/10/22
to pytroll
Hi Dave
This May I'll be 70. I have tried git a couple of times but never went very far. Sorry, I post again.
I further nail down the PyCoast problems we face. I now have a bug fix and a partial workaround.
I had a look at how GSHHG handles the dateline. The WEB page says (and I also checked in QGIS):
<cite>
1. ESRI shapefiles. This format is probably the most useful for users of GSHHG. Note that due to limitations of most (all?) GIS software and Google Earth, a handful of polygons straddling the Dateline (chief among them the Antarctic polar cap polygon) have been split into east and west components.
</cite>
https://www.soest.hawaii.edu/pwessel/gshhg/
That's why cylindric projections (like eqc or merc) of the whole globe work with lon_0=0°, lon=+/-180° while with lon_0=180°, lon=0°-360° they will cut Africa, Eurasia and the UK in left and right parts and connect these with horizontal lines over the whole image as demonstrated already 8 years ago. The problem also exists when borders, lakes or rivers are cut in left and right parts. A theoretically simple solution would just lift the pen for unexpededly long segments.
https://groups.google.com/g/pytroll/c/tzmtaDuaGD4/m/kVrY2RZ93gEJ
The problem will also show up with conic projections but is normally hidden by a smaller area_extent that does not include the meridian opposite lon_0. With cylindric projections and reduced area_extents we basically face two different problems that I name A) and B). Below I use my OPC Mercator MSLP chart areas that are 80° wide with app. lat_min=16°, lat_max=65°.
A) We have a problem mainly due to the size of Eurasia
My Atlantic East area makes one scratch below Greenland when I use
Meteosat11, Atlantic East, opcae, central meridian lon_0=-30°, symmetric area_extent
while it seems to work fine without this scratch when I use
Meteosat11, Atlantic East, opcae, central meridian lon_0=0°, asymmetric area_extent
EXPLANATION: Opposite to -30° is 150° where the Eurasia polygon has a latitude of 59.6°
Setting lon_0=-30° means that the Eurasia polygon makes the horizontal scratch when lon
passes 150°. With lon_0=0° the opposite is at 180° where latitude is above my lat_max.
B) The real big problem with coastlines seems to show up when we include the dateline lon=+/-180°.
Pycoast works with a bounding box lon_min, lon_max, lat_min, lat_max derived from the area_extent and projection. This window is compared with the bounding boxes of the coastline polygons to sort out non relevant cases. For area_extents that do not include the dateline we have lon_min < lon_max. The PyCoast code works for that case except for problem A). For our area of the western Pacific (opcpw, including the dateline) with center meridian at 175° this evaluates to
lon_min = 135.12795371957384 lon_max = -144.796221854012
unfortunately the PyCoast code in file cw_base.py does not handle this case properly. It just tries *ALL* coastline polygons. But opposite to 175° is the UK at -5° that produces a lot of horizontal scratches. The code should and -- as far as I understand it -- can easily be improved for case B) while case A) can be at least worked around with the choice of lon_0 and an asymmetric area_extent.
Original cw_base.py in function add_shapes()
# Check if polygon is possibly relevant
s_lon_ll, s_lat_ll, s_lon_ur, s_lat_ur = shape.bbox
if lon_min > lon_max:
pass
elif (lon_max < s_lon_ll or lon_min > s_lon_ur or
lat_max < s_lat_ll or lat_min > s_lat_ur):
# Polygon is irrelevant
continue
My fix in cw_bas.py in function add_shapes()
# Check if polygon is possibly relevant
s_lon_ll, s_lat_ll, s_lon_ur, s_lat_ur = shape.bbox
if lon_min > lon_max:
if (lon_max < s_lon_ll and lon_min > s_lon_ur or
lat_max < s_lat_ll or lat_min > s_lat_ur):
continue
# Polygon is irrelevant
elif (lon_max < s_lon_ll or lon_min > s_lon_ur or
lat_max < s_lat_ll or lat_min > s_lat_ur):
# Polygon is irrelevant
continue
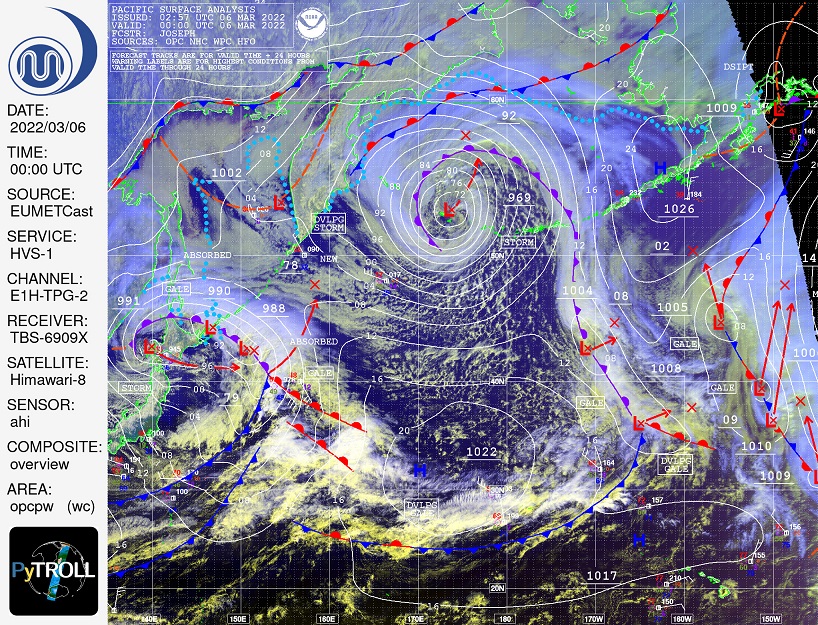
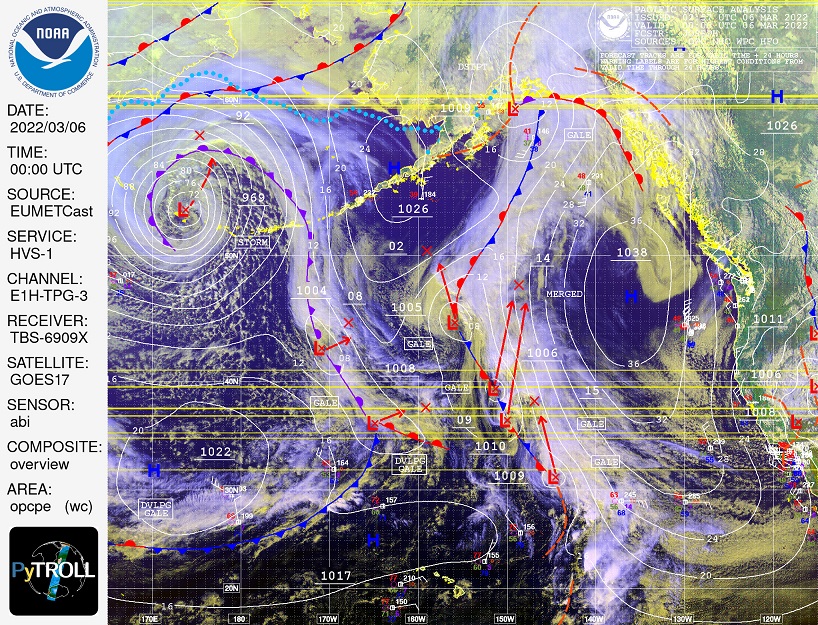
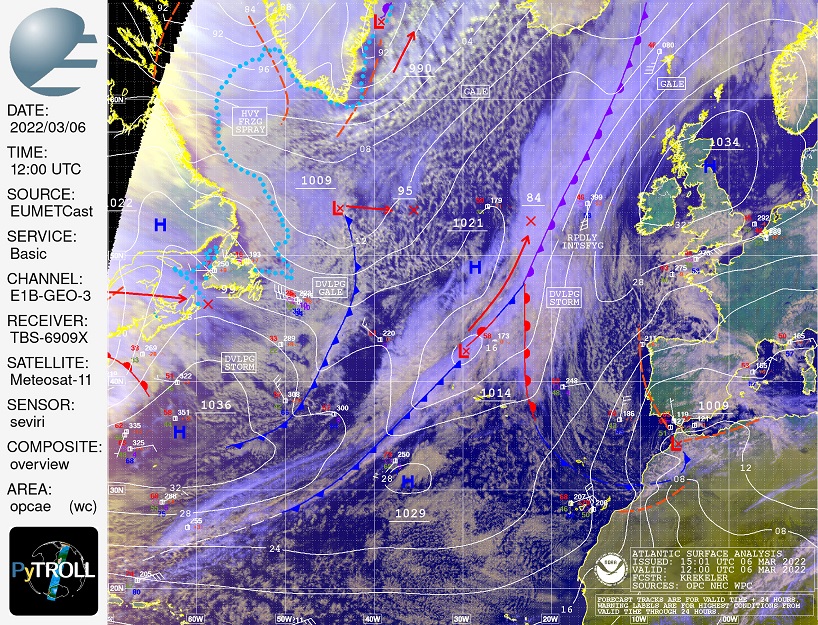
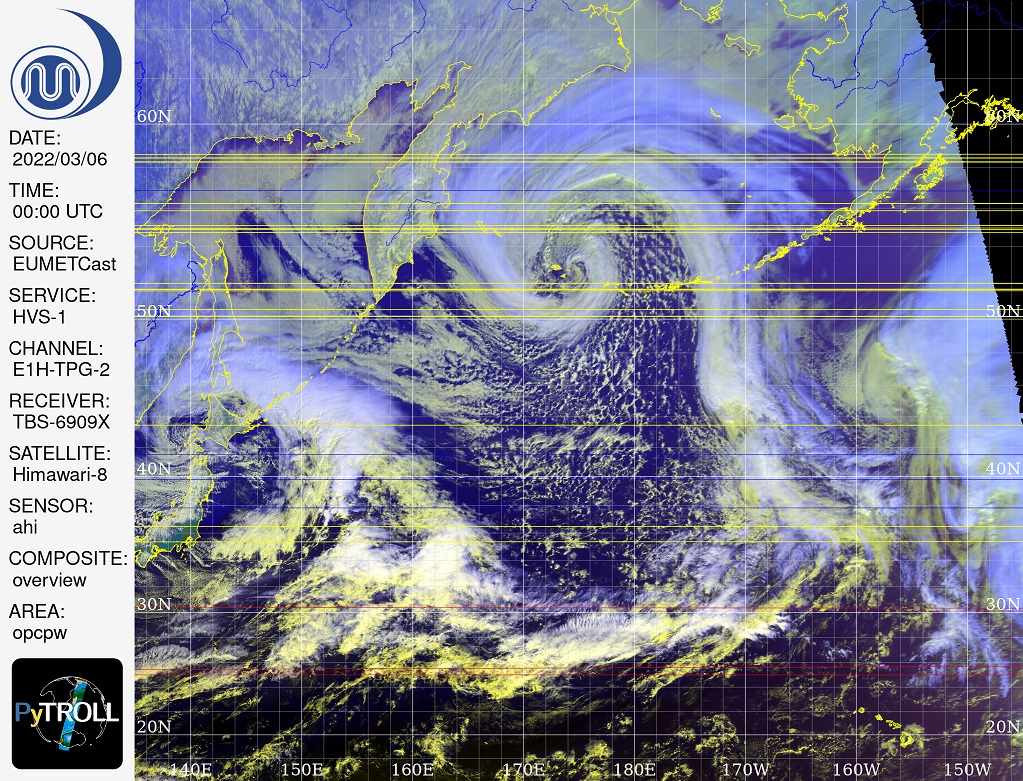
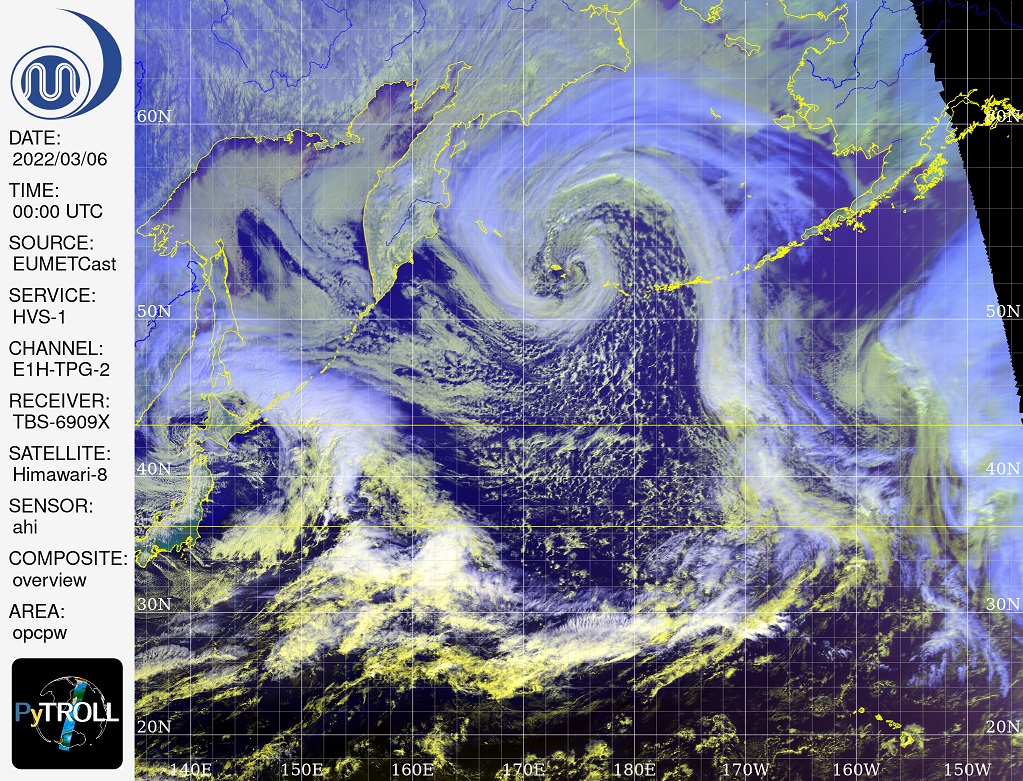
Below I add 3 Himawari8 images of my Pacific West area opcpw. I enable coastlines, borders and rivers. The first image is with lon_0=175° and symmetric area_extent. You see a lot of case B) coastline scratches (yellow), borders scratches (red) and rivers scratches (blue). The second image is opcpw with lon_0=175° and symmetric area_extent plus my above fix applied. We still have two case A) coastline scratches (yellow) that are due to Eurasia (Spain at lon=5°). In the third image opcpw uses lon_0=170° and a slightly asymmetric area_extent plus my above fix. Everything looks clean and works for me now. I still don't have a github account. Maybe some developer can have a look at my above fix and possibly make a PR for me. Thanks!
Best Regards,
Ernst
P.S.
There is another long standing BUG in that with omerc_bb the coastline of Ireland is sometimes missing.
This is probably also due to the above code if lon_min is not evaluated to what it should be for omerc_bb.
This May I'll be 70. I have tried git a couple of times but never went very far. Sorry, I post again.
I further nail down the PyCoast problems we face. I now have a bug fix and a partial workaround.
I had a look at how GSHHG handles the dateline. The WEB page says (and I also checked in QGIS):
<cite>
1. ESRI shapefiles. This format is probably the most useful for users of GSHHG. Note that due to limitations of most (all?) GIS software and Google Earth, a handful of polygons straddling the Dateline (chief among them the Antarctic polar cap polygon) have been split into east and west components.
</cite>
https://www.soest.hawaii.edu/pwessel/gshhg/
That's why cylindric projections (like eqc or merc) of the whole globe work with lon_0=0°, lon=+/-180° while with lon_0=180°, lon=0°-360° they will cut Africa, Eurasia and the UK in left and right parts and connect these with horizontal lines over the whole image as demonstrated already 8 years ago. The problem also exists when borders, lakes or rivers are cut in left and right parts. A theoretically simple solution would just lift the pen for unexpededly long segments.
https://groups.google.com/g/pytroll/c/tzmtaDuaGD4/m/kVrY2RZ93gEJ
The problem will also show up with conic projections but is normally hidden by a smaller area_extent that does not include the meridian opposite lon_0. With cylindric projections and reduced area_extents we basically face two different problems that I name A) and B). Below I use my OPC Mercator MSLP chart areas that are 80° wide with app. lat_min=16°, lat_max=65°.
A) We have a problem mainly due to the size of Eurasia
My Atlantic East area makes one scratch below Greenland when I use
Meteosat11, Atlantic East, opcae, central meridian lon_0=-30°, symmetric area_extent
while it seems to work fine without this scratch when I use
Meteosat11, Atlantic East, opcae, central meridian lon_0=0°, asymmetric area_extent
EXPLANATION: Opposite to -30° is 150° where the Eurasia polygon has a latitude of 59.6°
Setting lon_0=-30° means that the Eurasia polygon makes the horizontal scratch when lon
passes 150°. With lon_0=0° the opposite is at 180° where latitude is above my lat_max.
B) The real big problem with coastlines seems to show up when we include the dateline lon=+/-180°.
Pycoast works with a bounding box lon_min, lon_max, lat_min, lat_max derived from the area_extent and projection. This window is compared with the bounding boxes of the coastline polygons to sort out non relevant cases. For area_extents that do not include the dateline we have lon_min < lon_max. The PyCoast code works for that case except for problem A). For our area of the western Pacific (opcpw, including the dateline) with center meridian at 175° this evaluates to
lon_min = 135.12795371957384 lon_max = -144.796221854012
unfortunately the PyCoast code in file cw_base.py does not handle this case properly. It just tries *ALL* coastline polygons. But opposite to 175° is the UK at -5° that produces a lot of horizontal scratches. The code should and -- as far as I understand it -- can easily be improved for case B) while case A) can be at least worked around with the choice of lon_0 and an asymmetric area_extent.
Original cw_base.py in function add_shapes()
# Check if polygon is possibly relevant
s_lon_ll, s_lat_ll, s_lon_ur, s_lat_ur = shape.bbox
if lon_min > lon_max:
pass
elif (lon_max < s_lon_ll or lon_min > s_lon_ur or
lat_max < s_lat_ll or lat_min > s_lat_ur):
# Polygon is irrelevant
continue
My fix in cw_bas.py in function add_shapes()
# Check if polygon is possibly relevant
s_lon_ll, s_lat_ll, s_lon_ur, s_lat_ur = shape.bbox
if lon_min > lon_max:
if (lon_max < s_lon_ll and lon_min > s_lon_ur or
lat_max < s_lat_ll or lat_min > s_lat_ur):
continue
# Polygon is irrelevant
elif (lon_max < s_lon_ll or lon_min > s_lon_ur or
lat_max < s_lat_ll or lat_min > s_lat_ur):
# Polygon is irrelevant
continue
Below I add 3 Himawari8 images of my Pacific West area opcpw. I enable coastlines, borders and rivers. The first image is with lon_0=175° and symmetric area_extent. You see a lot of case B) coastline scratches (yellow), borders scratches (red) and rivers scratches (blue). The second image is opcpw with lon_0=175° and symmetric area_extent plus my above fix applied. We still have two case A) coastline scratches (yellow) that are due to Eurasia (Spain at lon=5°). In the third image opcpw uses lon_0=170° and a slightly asymmetric area_extent plus my above fix. Everything looks clean and works for me now. I still don't have a github account. Maybe some developer can have a look at my above fix and possibly make a PR for me. Thanks!
Best Regards,
Ernst
P.S.
There is another long standing BUG in that with omerc_bb the coastline of Ireland is sometimes missing.
This is probably also due to the above code if lon_min is not evaluated to what it should be for omerc_bb.
lobsiger...@gmail.com
Mar 10, 2022, 10:31:35 AM3/10/22
to pytroll
Hi All,
there is a small typo in the above post.
Regarding the second image "(Spain at lon=5°)" should read
"(Spain at lon=-5°)". Changing to lon_0=170° in the third image makes the cut abeam Spain at lon=-10° not hitting Eurasia anymore.
Cheers,
Ernst

Raspaud Martin
Mar 11, 2022, 3:12:28 AM3/11/22
to pyt...@googlegroups.com
Hi Ernst,
Thanks a lot for looking into this and for comming up with a solution,
it's very much appreciated!
Hopefully someone will have time to make a pull request out of it soon.
When this is done, we will come back with a link so you can have a say
before we do the merge.
I understand that you don't want to use github, but would it be
possible for you to create a git patch file? that would make it a lot
easier for us to put the changes in github in the first place. This
link seems to explain how to do it:
https://devconnected.com/how-to-create-and-apply-git-patch-files/
Best regards,
Martin
lobsiger...@gmail.com
Mar 11, 2022, 4:22:02 AM3/11/22
to pytroll
Martin and Dave,
I just wanted to make a patch with diff or git and then I noted that pycoast is now at 1.5.0 while my changes above are for pycoast 1.4.0.
And of course the very code concerned has changed as well ;-). The latest pycoast version still has the discussed problem but at least
I now understand what this is all about. So I will make a patch for the latest pycoast 1.5.0 and Christian Peters can possibly make a PR.
Stay tuned,
Ernst
lobsiger...@gmail.com
Mar 11, 2022, 7:34:46 AM3/11/22
to pytroll
Dear Christian, Martin and Dave,
Dear All,
SHORT FORM: For area_extents of less than 180° that include Eurasia use 10° <= lon_0 <= 170°.
For area_extents of more than 180° in longitude use lon_0 = 0°. Pray the rest is handled by my fix.
Here are two patches for pycoast 1.5.0. I do not have a git development branch but just used
$ git diff cw_base.py.dist cw_base.py > pycoast_1.5.0.gitpatch
$ diff -u cw_base.py.dist cw_base.py > pycoast_1.5.0.diffpatch
to generate them. I still hope this is of some help to produce a pull request. It works here.
Best Regards,
Ernst
# Name Version Build Channel
pycoast 1.5.0 pyhd8ed1ab_0 conda-forge
David Hoese
Mar 11, 2022, 9:59:53 PM3/11/22
to pyt...@googlegroups.com
Ernst (and Christian),
Thanks so much for this patch and the overall investigation. I've made a
new comment on the related github issue with a test script that has a
line without your fix and doesn't have the line after your fix.
This all got me thinking though about another possible (additional?)
solution. I'm not sure I understand all the cases you've tried out and
why they do or do not work and I haven't looked at every bit of this
code so I could be missing something...but: Shouldn't we be able to fix
all other cases by clipping (also called clamping) the projection
coordinates of the shapes to the extents of the image? So if a shape is
split across the left bound of the image, then we set any coordinates of
that shape left of that boundary to the edge of that boundary (just
outside the image). Same would be done for the top and bottom bounds.
I'm not sure if I'm misunderstanding the issue, but thought I'd run it
by you.
</late night ramblings>
Dave
> https://devconnected.com/how-to-create-and-apply-git-patch-files/ <https://devconnected.com/how-to-create-and-apply-git-patch-files/>
> --
> You received this message because you are subscribed to a topic in the
> Google Groups "pytroll" group.
> To unsubscribe from this topic, visit
> https://groups.google.com/d/topic/pytroll/xTFZW1ptH7s/unsubscribe
> <https://groups.google.com/d/topic/pytroll/xTFZW1ptH7s/unsubscribe>.
> To unsubscribe from this group and all its topics, send an email to
> pytroll+u...@googlegroups.com
> <mailto:pytroll+u...@googlegroups.com>.
> To view this discussion on the web, visit
> https://groups.google.com/d/msgid/pytroll/59663e9f-9b36-467a-bc4a-1683c36518afn%40googlegroups.com
> <https://groups.google.com/d/msgid/pytroll/59663e9f-9b36-467a-bc4a-1683c36518afn%40googlegroups.com?utm_medium=email&utm_source=footer>.
Thanks so much for this patch and the overall investigation. I've made a
new comment on the related github issue with a test script that has a
line without your fix and doesn't have the line after your fix.
This all got me thinking though about another possible (additional?)
solution. I'm not sure I understand all the cases you've tried out and
why they do or do not work and I haven't looked at every bit of this
code so I could be missing something...but: Shouldn't we be able to fix
all other cases by clipping (also called clamping) the projection
coordinates of the shapes to the extents of the image? So if a shape is
split across the left bound of the image, then we set any coordinates of
that shape left of that boundary to the edge of that boundary (just
outside the image). Same would be done for the top and bottom bounds.
I'm not sure if I'm misunderstanding the issue, but thought I'd run it
by you.
</late night ramblings>
Dave
> You received this message because you are subscribed to a topic in the
> Google Groups "pytroll" group.
> To unsubscribe from this topic, visit
> https://groups.google.com/d/topic/pytroll/xTFZW1ptH7s/unsubscribe
> <https://groups.google.com/d/topic/pytroll/xTFZW1ptH7s/unsubscribe>.
> To unsubscribe from this group and all its topics, send an email to
> pytroll+u...@googlegroups.com
> <mailto:pytroll+u...@googlegroups.com>.
> To view this discussion on the web, visit
> https://groups.google.com/d/msgid/pytroll/59663e9f-9b36-467a-bc4a-1683c36518afn%40googlegroups.com
> <https://groups.google.com/d/msgid/pytroll/59663e9f-9b36-467a-bc4a-1683c36518afn%40googlegroups.com?utm_medium=email&utm_source=footer>.
lobsiger...@gmail.com
Mar 13, 2022, 9:03:28 AM3/13/22
to pytroll
Dave,
the projection coordinates of the shapes *ARE* clipped to the extents of the image! But this problem started with scratches on a Plate Carreé fully inside the area_extent. That's even more obvious on the images below (the Sinusoidal resampling does not work?). For smaller area_extents coastline segments starting far left of the image and ending far right are also clipped and appear as scratches if they pass the area_extent. We must certainly forget a solution that works for all what PyProj offers. To project the whole surface of the globe think of a rubber sphere that you have to "cut" somewhere to be able to distort and flatten it out on a plane. For cylindric and conic projections as well as all pseudocylindrical projections like Mollweide, Aitoff, Hammer, Sinusoidal this cut is the meridian opposite to lon_0. For all conic projections and also for the pseudoconic Bonne projection of the whole globe the cut can even loom inside your ara_extent. For azimutal projections like the Stereographic the "cut" is actually only a pinhole punched in the rubber sphere on the opposite side of (lon_0, lat_0). For more exotic projections like the Lee tetrahedric conformal there are even two cuts of different length that intersect at 90°. For projections of the whole sphere these cuts are mapped to the border of the image with singular points at its ends. Whenever a GSHHG shape crosses a cut this will scratch across your image. So on a global scale and if you even allow for all "aspects" (3D rotation of the globe beforehand) of the projections it's mission impossible to come up with a clean general solution. You will have to monitor the projection specific cut and maybe divide shape segments in 2 parts to exactly draw to the border and then lift the pen when going from one side to the other side of the cut. You can only avoid these problems if you manage to make the cut of your projection possibly far from coastlines, borders, rivers and lakes (which is essentially only possible for azimutal projections). These are just my thoughts not looking at the pycoast code in detail but remembering some Fortran programming work I did 40 years ago.
For general cases in PyTROLL/Satpy that depict the whole globe just use lon_0=0°, lat_0=0° (the default) and everything should be fine due to the division of western and eastern polygons in GSHHG. Full disk images of GEO satellites do not seem to be affected by my patch. The clipping problem here is entirely different and similar to the Orographic projection. If you look at a 3D-globe in the negative x-direction you can (lat,lon) --> (x,y,z) and clipp segments with x < 0. But I assume that users of PyTROLL/Satpy mostly use even much smaller rectangular area_extents. Here you can avoid problems if you sort out possibly harmful shapes. I cannot think of medium sized area_extents of a cylindrical projection where my fix should not suppress these horizontal scratches of pycoast issue 23 except for cases when coastlines (or even only the bounding box that spans more than 180° in longitude!) of the huge Eurasia polygon also looms inside your area_extent. In this latter case the additional workaround to avoid problems is to use 0° <= lon_0 <= 170° and possibly an asymmetric (x-coordinate) area_extent. Conical projections like Lambert Conic Conformal used for different DWD MSLP charts are clean because possible scratches pass over the top of the image anyway. For some exotic projections we should have an even closer look at the function _get_lon_lat_bounding_box(). I already mentionned long ago that I suspect this function to be the cause of another long standing BUG in that Ireland sometimes gets no coastline with omerc_bb projections. I'll check that next ...
I attach a script and the OPC MSLP area definitions I use. All areas are merc 80° wide in longitude. Most scratches are suppressed by my fix. But 3 out of 4 areas also do use lon_0=10° or lon_0=170° with corresponding asymmetric area_extents to get rid of the remaining Eurasia scratch problem. That said going to area_extents that span more than 90° in longitude the situation gets more and more difficult. Finally, also depending on the latitude band, the only solution is lon_0=0°.
Cheers,
Ernst
P.S.
The scratch at lat=5° in your example is produced by not excluding the Africa polygon that has lat=5° at lon=-2.5°.
This can easily be found out by loading the corresponding coastline shape file in a GIS like the free and OS QGIS.
David Hoese
Mar 14, 2022, 9:39:38 AM3/14/22
to pyt...@googlegroups.com
Ernst,
Thanks for the info and the example script. Assuming it can be done
computationally quickly, what if we checked the distance in projection
space between each coordinate being drawn? If it is greater than some
distance (ex. 75% of the extent of the image?) then we remove one of
those coordinates. Or maybe add two additional coordinates, one on the
left side of the antimeridian and one on the right so that the shape is
"clipped" to the boundary...at least in more "traditional" projections.
Or am I still missing a major common case?
I don't want to do it this month, but I'm starting to get the itch to
rewrite a lot of this shapefile/polygon logic.
Dave
> <https://groups.google.com/d/msgid/pytroll/59663e9f-9b36-467a-bc4a-1683c36518afn%40googlegroups.com?utm_medium=email&utm_source=footer
> <https://groups.google.com/d/msgid/pytroll/59663e9f-9b36-467a-bc4a-1683c36518afn%40googlegroups.com?utm_medium=email&utm_source=footer>>.
> <https://groups.google.com/d/msgid/pytroll/b0df53a4-4037-4ee2-b343-c616a01fbde1n%40googlegroups.com?utm_medium=email&utm_source=footer>.
Thanks for the info and the example script. Assuming it can be done
computationally quickly, what if we checked the distance in projection
space between each coordinate being drawn? If it is greater than some
distance (ex. 75% of the extent of the image?) then we remove one of
those coordinates. Or maybe add two additional coordinates, one on the
left side of the antimeridian and one on the right so that the shape is
"clipped" to the boundary...at least in more "traditional" projections.
Or am I still missing a major common case?
I don't want to do it this month, but I'm starting to get the itch to
rewrite a lot of this shapefile/polygon logic.
Dave
> <https://groups.google.com/d/msgid/pytroll/59663e9f-9b36-467a-bc4a-1683c36518afn%40googlegroups.com?utm_medium=email&utm_source=footer>>.
>
>
> --
> You received this message because you are subscribed to a topic in the
> Google Groups "pytroll" group.
> To unsubscribe from this topic, visit
> https://groups.google.com/d/topic/pytroll/xTFZW1ptH7s/unsubscribe
> <https://groups.google.com/d/topic/pytroll/xTFZW1ptH7s/unsubscribe>.
> To unsubscribe from this group and all its topics, send an email to
> pytroll+u...@googlegroups.com
> <mailto:pytroll+u...@googlegroups.com>.
> To view this discussion on the web, visit
> https://groups.google.com/d/msgid/pytroll/b0df53a4-4037-4ee2-b343-c616a01fbde1n%40googlegroups.com
>
> --
> You received this message because you are subscribed to a topic in the
> Google Groups "pytroll" group.
> To unsubscribe from this topic, visit
> https://groups.google.com/d/topic/pytroll/xTFZW1ptH7s/unsubscribe
> <https://groups.google.com/d/topic/pytroll/xTFZW1ptH7s/unsubscribe>.
> To unsubscribe from this group and all its topics, send an email to
> pytroll+u...@googlegroups.com
> <mailto:pytroll+u...@googlegroups.com>.
> To view this discussion on the web, visit
> <https://groups.google.com/d/msgid/pytroll/b0df53a4-4037-4ee2-b343-c616a01fbde1n%40googlegroups.com?utm_medium=email&utm_source=footer>.
lobsiger...@gmail.com
Mar 14, 2022, 12:01:40 PM3/14/22
to pytroll
Dave,
you are missing that I have proposed the "greater than some distance" idea in the first post of this thread as a crude workaround, not as a solution. And you have pointed me to Github pycoast issue 23 where I found that this workaround has been proposed on the google PyTROLL list in 2014 already (while I made my first steps in Python 2018).
https://groups.google.com/g/pytroll/c/tzmtaDuaGD4/m/kVrY2RZ93gEJ
And my last images show that it cannot not work for pseudo cylindrical projections of the full globe (Mollweide is found in the Satpy distributed areas.yaml file). And my last post says it can fail for conic and other projections as well.
While my fix does speed up a lot cases that include the dateline your proposal will slow pycoast down considerably.
I PROPOSE: You or one of the developers take my Git patch and my example script above and make a PR for me. It's 5 minutes for you and probably 14 days for me. My patch can then be reviewed as usual. Unless you can come up with a common use case (not the one attached) where my fix (+ maybe additional easy workaround for Eurasia) fails, I'm at the loss of understanding why you want to start to rewrite things in Pycoast that do work. If it ain't broken don't fix it.
If you get the itch to do something useful in pycoast please help debug function _get_lon_lat_bounding_box(). I can now clearly demonstrate that this function fails for projection "omerc_bb" for LEOs that pass app. 5-15° East of London. When the bottom left corner of the area_extent has a positive longitude, then lon_min is always returned very close to 0°. This results in grids, coastlines, borders and rivers not being drawn (because considered "irrelevant") west of 0° longitude.
Best Regards,
Ernst
Attached: Lee Tetrahedric 1975, a double periodic projection using Jacobi Elliptical Functions sn(), cn(), dn() ...
lobsiger...@gmail.com
Mar 14, 2022, 12:14:30 PM3/14/22
to pytroll
Oops, one more typo: It's "Lee 1973" not "Lee 1975". I was probably thinking of Cirrus 75, my favorite Standard Class sailplaine at that time ...
lobsiger...@gmail.com
Mar 18, 2022, 4:49:29 PM3/18/22
to pytroll
Dear All,
here is an improved test script that includes gridlines. It also shows vertical scratches for projection tmerc I have not seen demonstrated yet (rubber sphere is cut along equator!)
Regards,
Ernst
Reply all
Reply to author
Forward
0 new messages