log(x) axis with negative powers of ten
24 views
Skip to first unread message

Guillaume William Bres
Feb 27, 2018, 10:13:28 AM2/27/18
to pyqtgraph
Hi,
I'm building an application where I need to monitor frequency domain data and we use the log(x) feature all the time.
My x (frequency) axis ranges from 1e6 (MHz) down to 1e-3 (mHz) and it seems like pyqtgraph is not capable of dealing with 1e^n as long as N<0, by "not dealing", I mean I am no longer getting proper ticks, lines are not displayed and displaying is messed up (dHz & mHz are not even displayed).
Is there a way I can work around this by creating a custom axis item?
I always build PyQtGraph from the "master" branch which is fairly outdated, should I switch to "develop"?
Message has been deleted
Guillaume William Bres
Mar 7, 2018, 9:09:11 AM3/7/18
to pyqtgraph
so it turned out the log(x) display was somehow corrupted by my xRange(xMin,xMax) values.
My x values range from 0 to 1e7 (0 to 10MHz). My actual data ranges from 1e-3 (1mHz) to 1e7 (10MHz). I previously set xRange(1e-9 to 1e7) to avoid log(0) @xMin and so the user can slightly scroll below the smallest x value.
In this setup I am no longer getting nicely logarithmically spaced vertical lines, 1e^n where n<0 are not displayed. Then modified xRange to (-100,1e7) and now I am getting proper vertical lines.
So xRange(-100,1e7) is a solution to get proper vertical lines, but the overall UI is no longer super nice because my values never reach x<0, and the user can actually scroll down to -100(whatever xMin value I set)
don't know what's happening with axisItems or whatever class is used in all of that

Luke Campagnola
Mar 7, 2018, 12:34:53 PM3/7/18
to pyqt...@googlegroups.com
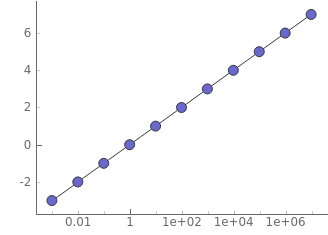
Can you post a code example? Here's my simple test:
And the output looks correct to me:>>> import pyqtgraph as pg
>>> import numpy as np
>>> plt = pg.plot(10.0**np.arange(-3,8), np.arange(-3,8), symbol='o')
>>> plt.setLogMode(x=True, y=False)
>>> import numpy as np
>>> plt = pg.plot(10.0**np.arange(-3,8), np.arange(-3,8), symbol='o')
>>> plt.setLogMode(x=True, y=False)
--
You received this message because you are subscribed to the Google Groups "pyqtgraph" group.
To unsubscribe from this group and stop receiving emails from it, send an email to pyqtgraph+unsubscribe@googlegroups.com.
To view this discussion on the web visit https://groups.google.com/d/msgid/pyqtgraph/f1764361-15a6-4d91-a4de-59ac31916a0c%40googlegroups.com.
Reply all
Reply to author
Forward
0 new messages