Scrolling plots: when symbol arg is passed to plot(), scrolling left does not work
54 views
Skip to first unread message

Mark
Jan 11, 2017, 8:23:41 PM1/11/17
to pyqtgraph
Hi Luke -
Thanks for all your work in pyqtgraph.
I'm using 0.10.0 with PyQT 5.7 on Windows 7.
I have built a scrolling chart that loads data from a pandas dataframe that is populated from another process. It creates PlotDataItems with 500 data points each. Then applies np.empty() to the numpy array it and loads it again with new data, etc.
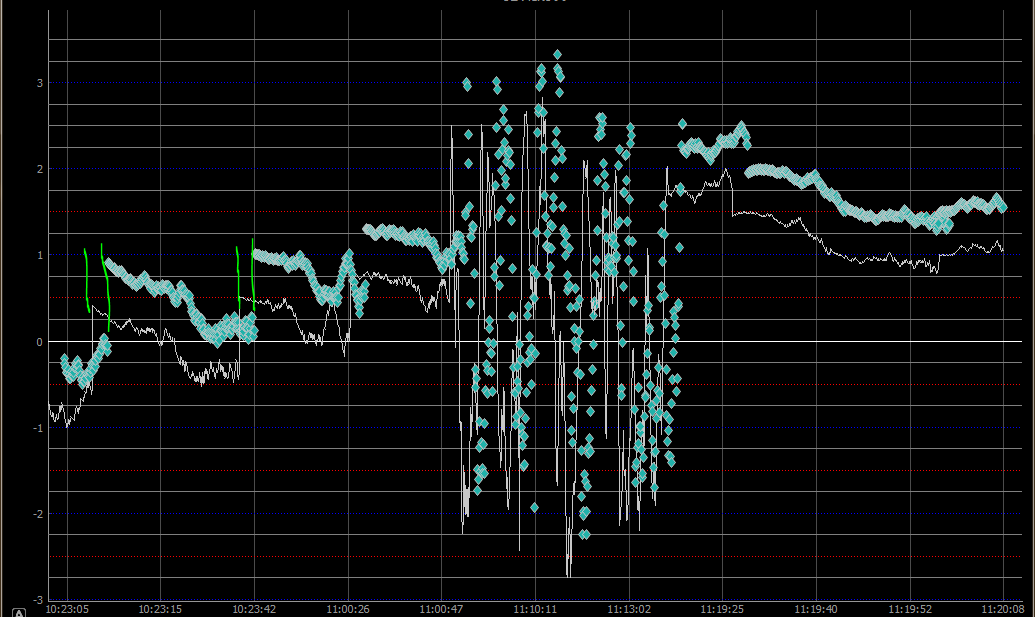
I have found that when I add a 'symbol' argument to the plot() method (see below), the previous PlotDataItems do not get shifted left during the shift process. However, the current PlotDataItem shifts to the left, correctly, in this situation. (See the attached screenshot: 'top_symbol_curve_does_not_shift_left.PNG' - you'll note lime green lines at the left of the screenshot where the top symbol-based plotdataitems get out of sync with the 'white line' plotdataitem.
However, when I take out the symbol argument, the second line scrolls to the left perfectly (as you probably know - this a modification from one of your samples). See 'both_curves_shift_left.PNG' screenshot for how this works correctly.
<SNIPPET>
for index,row in pandas_df.iterrows():
move_value = move_position(0.15) # THIS IS A CALL TO A FUNCTION THAT GENERATES AN INCREMENTED VALUE INSTEAD OF USING NOW() TIMESTAMP
shift = (move_value * -1)
for c in curves:
c.setPos(shift, 0) # moves the curve
for c2 in curves2:
c2.setPos(shift,0)
i = ptr5 % 500
if i==0:
curve = p5.plot()
curves.append(curve)
curve2 = p5.plot(pen=(32,178,170)) #<- WORKS FINE
#curve2 = p5.plot(pen=None,symbol='d', symbolBrush=(32,178,170)) <- ONLY THE CURRENT PLOTDATA ITEM SHIFTS. PREVIOUS ONES DO NOT
curves2.append(curve2)
last = data5[-1] #return last item in the list
last2 = pyqt_dot_np[-1]
data5 = np.empty([501,2]) #Return a new array of given shape and type, without initializing entries.
pyqt_dot_np = np.empty([501,2])
data5[0] = last
pyqt_dot_np[0] = last2
else:
curve = curves[-1] #return last item in the list
curve2 = curves2[-1]
vb = curve.getViewBox()
xrange = vb.viewRange()[0]
data5[i+1,0] = move_value
pyqt_dot_np[i+1,0] = move_value
data5[i+1,1] = row['Zscores'] # 2-D array - y values
curve.setData(x=data5[:i+2, 0], y=data5[:i+2, 1])
pyqt_dot_np[i+1,1] = row['Zscores'] + 0.5
curve2.setData(x=pyqt_dot_np[:i+2, 0], y=pyqt_dot_np[:i+2, 1])
</SNIPPET>
Is this a bug?
Do I need to do something differently to scroll previously added symbol objects.
Thanks kindly,
Mark

Luke Campagnola
Jan 13, 2017, 3:20:33 AM1/13/17
to pyqt...@googlegroups.com
It's a bug! Would you mind opening a new issue on github?
Here's a workaround:
curve.scatter.updateSpots()
curve.scene().update()
--
You received this message because you are subscribed to the Google Groups "pyqtgraph" group.
To unsubscribe from this group and stop receiving emails from it, send an email to pyqtgraph+unsubscribe@googlegroups.com.
To view this discussion on the web visit https://groups.google.com/d/msgid/pyqtgraph/165f6a48-5606-4bfd-b2e1-5c548c53012f%40googlegroups.com.
For more options, visit https://groups.google.com/d/optout.
Mark
Jan 13, 2017, 7:46:34 AM1/13/17
to pyqtgraph
Thanks Luke and thanks for the work-around.
I will post a new issue this weekend.
Mark
To unsubscribe from this group and stop receiving emails from it, send an email to pyqtgraph+...@googlegroups.com.
Mark
Jan 15, 2017, 9:30:32 PM1/15/17
to pyqtgraph
Luke - the work-around fixed it.
Thanks!
Reply all
Reply to author
Forward
0 new messages