Pixel data into image
195 views
Skip to first unread message

Suman Gautam
Aug 7, 2022, 10:49:52 PM8/7/22
to pydicom
Hi
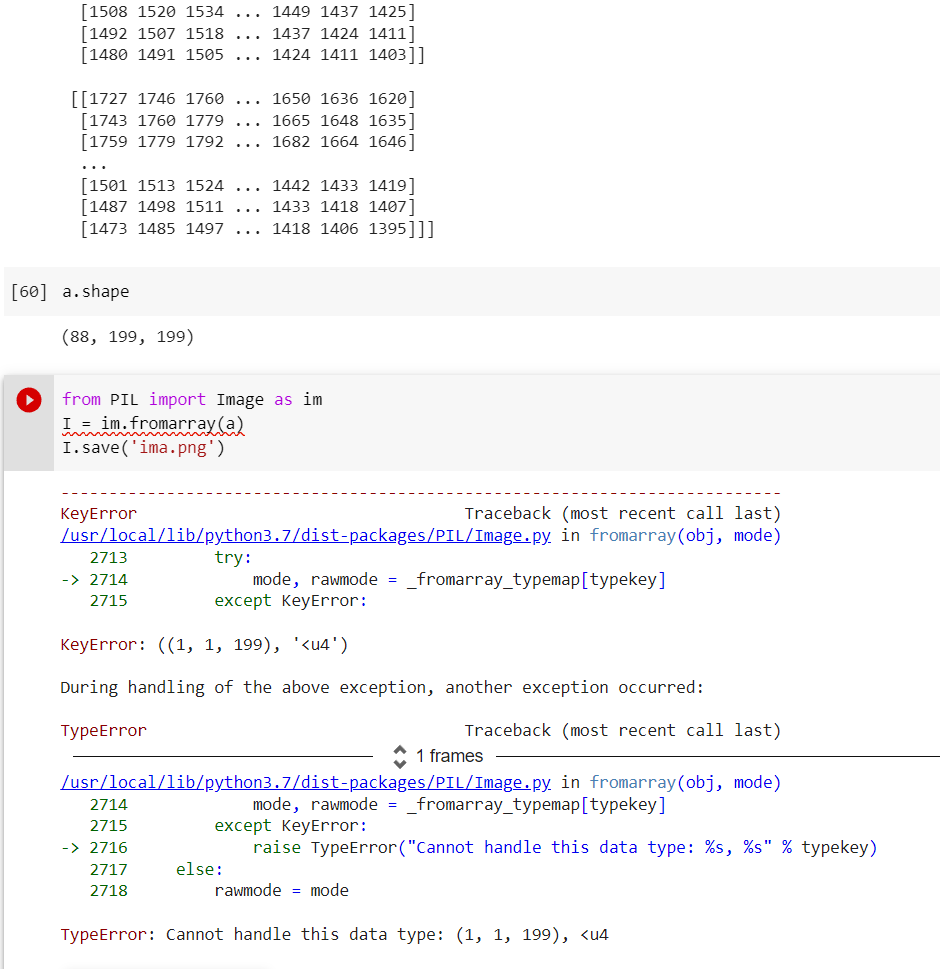
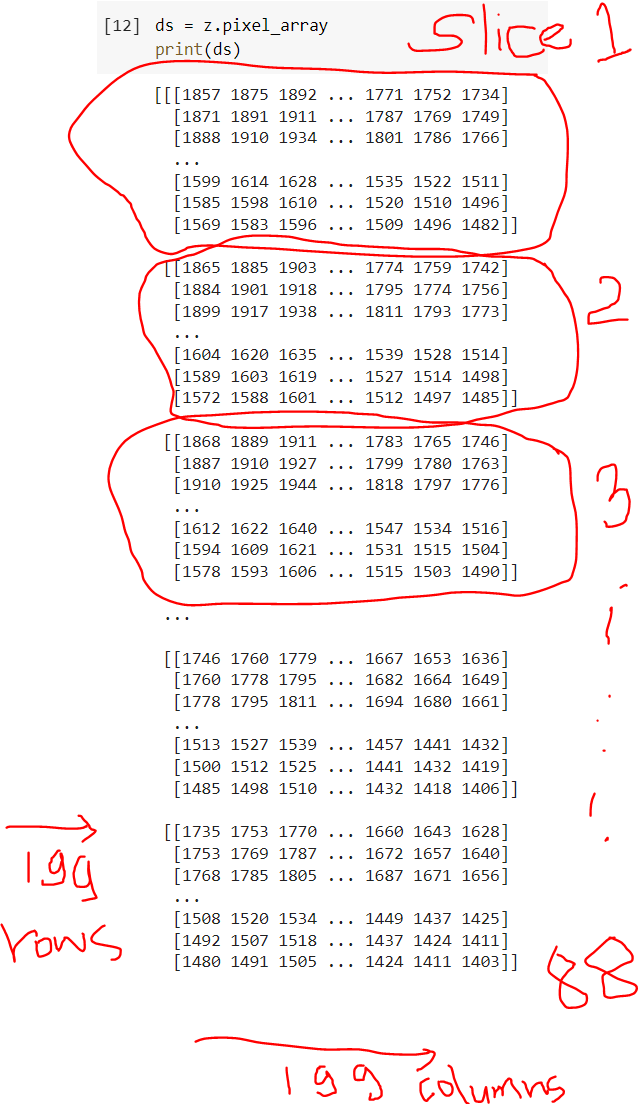
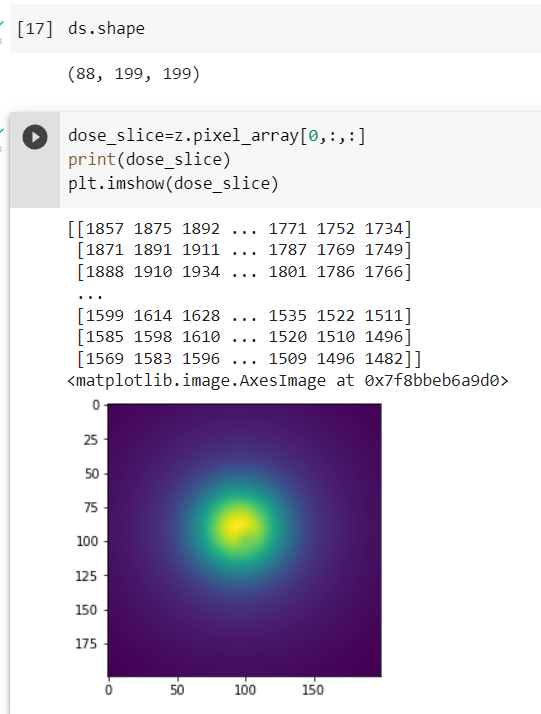
I have pixel array from the DICOM dose files. This array represents the intensity of the voxels. It is an array of 88x199x199 of dtype = uint32. This conversion into image represents the dose distribution.
It always gives an error that python cannot handle these data. How can i convert those huge arrays into the dose distribution? Do you have any easy ways of converting in python?
Thank you very much

dan.cu...@gmail.com
Aug 8, 2022, 10:10:14 AM8/8/22
to pydicom
I think dicompyler-core should help you out.
Suman Gautam
Aug 8, 2022, 10:40:09 AM8/8/22
to pyd...@googlegroups.com
Thank you very much.
This is an error I am facing.
Thank you
----------------
Regards,
Suman Gautam
PhD Student
Department of Radiation Oncology.
Division of Medical Physics
VIRGINIA COMMONWEALTH UNIVERSITY
|
|
Sender notified by Mailtrack | 08/08/22, 10:39:40 AM |

--
You received this message because you are subscribed to the Google Groups "pydicom" group.
To unsubscribe from this group and stop receiving emails from it, send an email to pydicom+u...@googlegroups.com.
To view this discussion on the web visit https://groups.google.com/d/msgid/pydicom/041cc14a-a29a-4653-9854-2e7e18e4555cn%40googlegroups.com.
dan.cu...@gmail.com
Aug 8, 2022, 11:07:25 AM8/8/22
to pydicom
I'm not sure what you're trying to do? It looks like you want to save a 3D array as a PNG? Depending on what you're trying to do, you might need to work with one slice at a time
Here's an example of how to display one slice using matplotlib:
import pydicom
import matplotlib.pyplot as plt
ds = pydicom.read_file('rtdose.dcm')
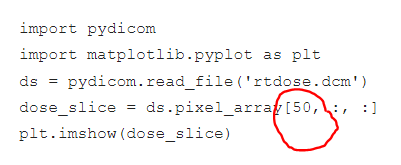
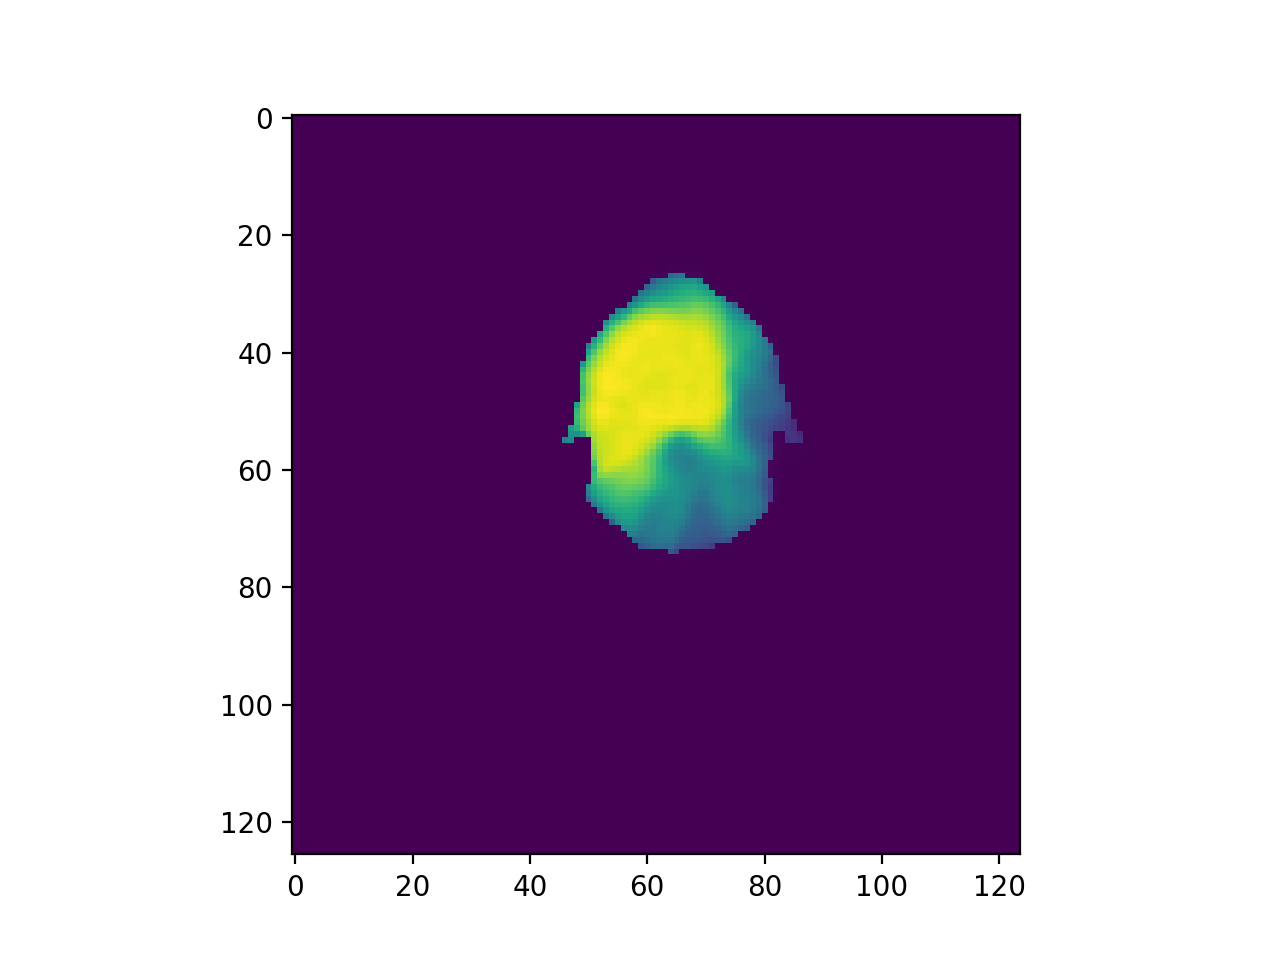
dose_slice = ds.pixel_array[50, :, :]
plt.imshow(dose_slice)
import matplotlib.pyplot as plt
ds = pydicom.read_file('rtdose.dcm')
dose_slice = ds.pixel_array[50, :, :]
plt.imshow(dose_slice)
Suman Gautam
Aug 8, 2022, 11:23:22 AM8/8/22
to pyd...@googlegroups.com
Thank you very much.
I get the dose distribution per slice. But I want to print a 3D dose distribution. So, Can I combine all those silices? I think combining all those slices gives the complete dose distribution. Also How can I get the dose distribution along coronal, sagittal and transverse ?
----------------
Regards,
Suman Gautam
PhD Student
Department of Radiation Oncology.
Division of Medical Physics
VIRGINIA COMMONWEALTH UNIVERSITY
|
|
Sender notified by Mailtrack |
| 08/08/22, 11:20:30 AM |

To view this discussion on the web visit https://groups.google.com/d/msgid/pydicom/c8a28e93-08eb-400c-a998-273ede8e4134n%40googlegroups.com.
dan.cu...@gmail.com
Aug 8, 2022, 11:34:21 AM8/8/22
to pydicom
Can you point us to an example an analogous printed 3D image? I'm not sure what that means. At best you could generate a 3D isodose structure and view it in a 3D viewer?
To get slices in other dimensions, just iterate the colons (:) in different places:
dose_slice = ds.pixel_array[z, :, :]
dose_slice = ds.pixel_array[:, y, :]
dose_slice = ds.pixel_array[:, :, x]
I wrote a module in dicompyler-core for dose grids, it might have some helpful code:
Suman Gautam
Aug 8, 2022, 11:45:40 AM8/8/22
to pyd...@googlegroups.com
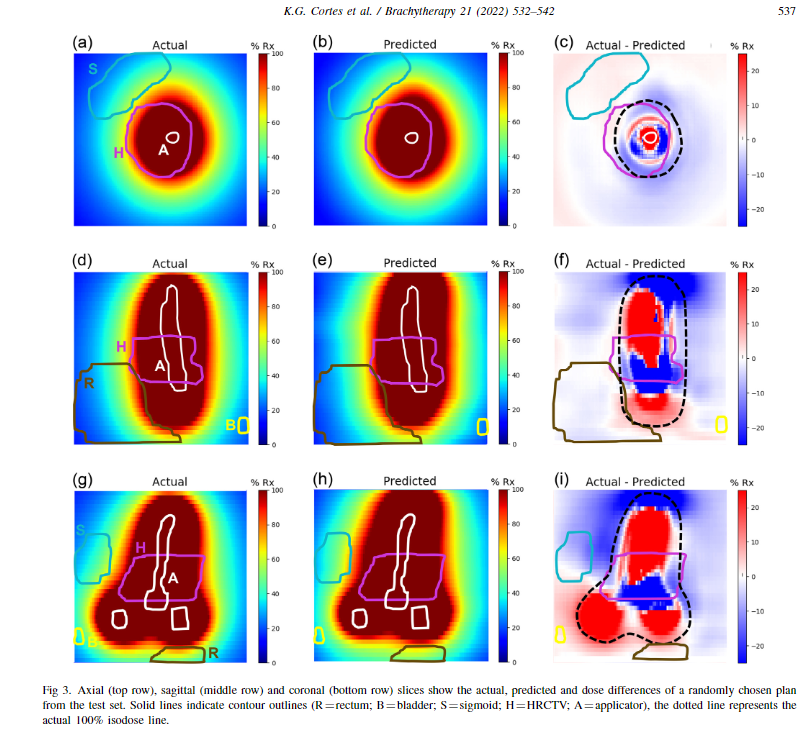
The attached below is the dose distribution along axial, sagittal and coronal view. The actual dose distribution is what I am looking at from that array. It alone represents some OARs drawn in colour, like circles and white represents the tandem of an applicator used in brachytherapy. The array shown above is the 88 x 199x 199.
In the second attached image, 50 represents the slice number in the z axis, right? So, I am getting the dose distribution of 50 slices, Is that make sense? But What i am looking for is the complete dose distribution of that 88 slices.
----------------
Regards,
Suman Gautam
PhD Student
Department of Radiation Oncology.
Division of Medical Physics
VIRGINIA COMMONWEALTH UNIVERSITY
|
|
Sender notified by Mailtrack |
| 08/08/22, 11:43:25 AM |

To view this discussion on the web visit https://groups.google.com/d/msgid/pydicom/50ca9ed4-0a4f-4999-a885-3bc530f350dfn%40googlegroups.com.
dan.cu...@gmail.com
Aug 8, 2022, 11:51:43 AM8/8/22
to pydicom
The 50 you've circled represents the index in the z-dimension. So it's only one slice. Conceptually, I still don't understand how one 2D image can represent a 3D dataset?
Suman Gautam
Aug 8, 2022, 11:58:19 AM8/8/22
to pyd...@googlegroups.com
I want to combine all those 88 slices.
----------------
Regards,
Suman Gautam
PhD Student
Department of Radiation Oncology.
Division of Medical Physics
VIRGINIA COMMONWEALTH UNIVERSITY
|
|
Sender notified by Mailtrack |
| 08/08/22, 11:57:33 AM |

To view this discussion on the web visit https://groups.google.com/d/msgid/pydicom/152fd17a-64aa-4628-a1b8-90a209cf2407n%40googlegroups.com.
dan.cu...@gmail.com
Aug 8, 2022, 12:02:30 PM8/8/22
to pydicom
I'm still not sure what that means? If you mean an integral dose in a particular dimension... you could sum the slices before image generation. But I don't see the value in that?
Maybe it's more productive if you explain what you'd like do with the final image?
Suman Gautam
Aug 8, 2022, 12:19:28 PM8/8/22
to pyd...@googlegroups.com
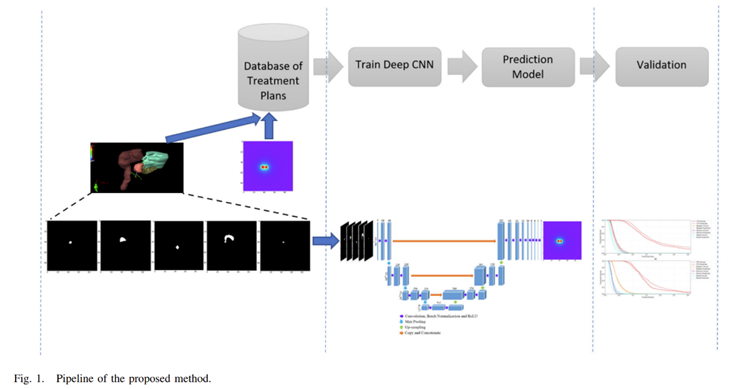
Actually, I am calculating the actual dose distribution along axial, sagittal and transverse view, which are utilized for the neural networks. I have attached below the pipeline of my model. Yes, an integral dose in a particular dimension is what I am looking for. You mean sum all the pixel values with their corresponding rows and columns.
----------------
Regards,
Suman Gautam
PhD Student
Department of Radiation Oncology.
Division of Medical Physics
VIRGINIA COMMONWEALTH UNIVERSITY
|
|
Sender notified by Mailtrack |
| 08/08/22, 12:18:57 PM |

You received this message because you are subscribed to a topic in the Google Groups "pydicom" group.
To unsubscribe from this topic, visit https://groups.google.com/d/topic/pydicom/nPLMHpY7Ko0/unsubscribe.
To unsubscribe from this group and all its topics, send an email to pydicom+u...@googlegroups.com.
To view this discussion on the web visit https://groups.google.com/d/msgid/pydicom/526fffeb-685b-4e5d-adf6-a681d23c8047n%40googlegroups.com.
Dan Cutright
Aug 8, 2022, 12:31:07 PM8/8/22
to pyd...@googlegroups.com
import pydicom
import matplotlib.pyplot as plt
import matplotlib.pyplot as plt
import numpy as np
ds = pydicom.read_file('rtdose.dcm')
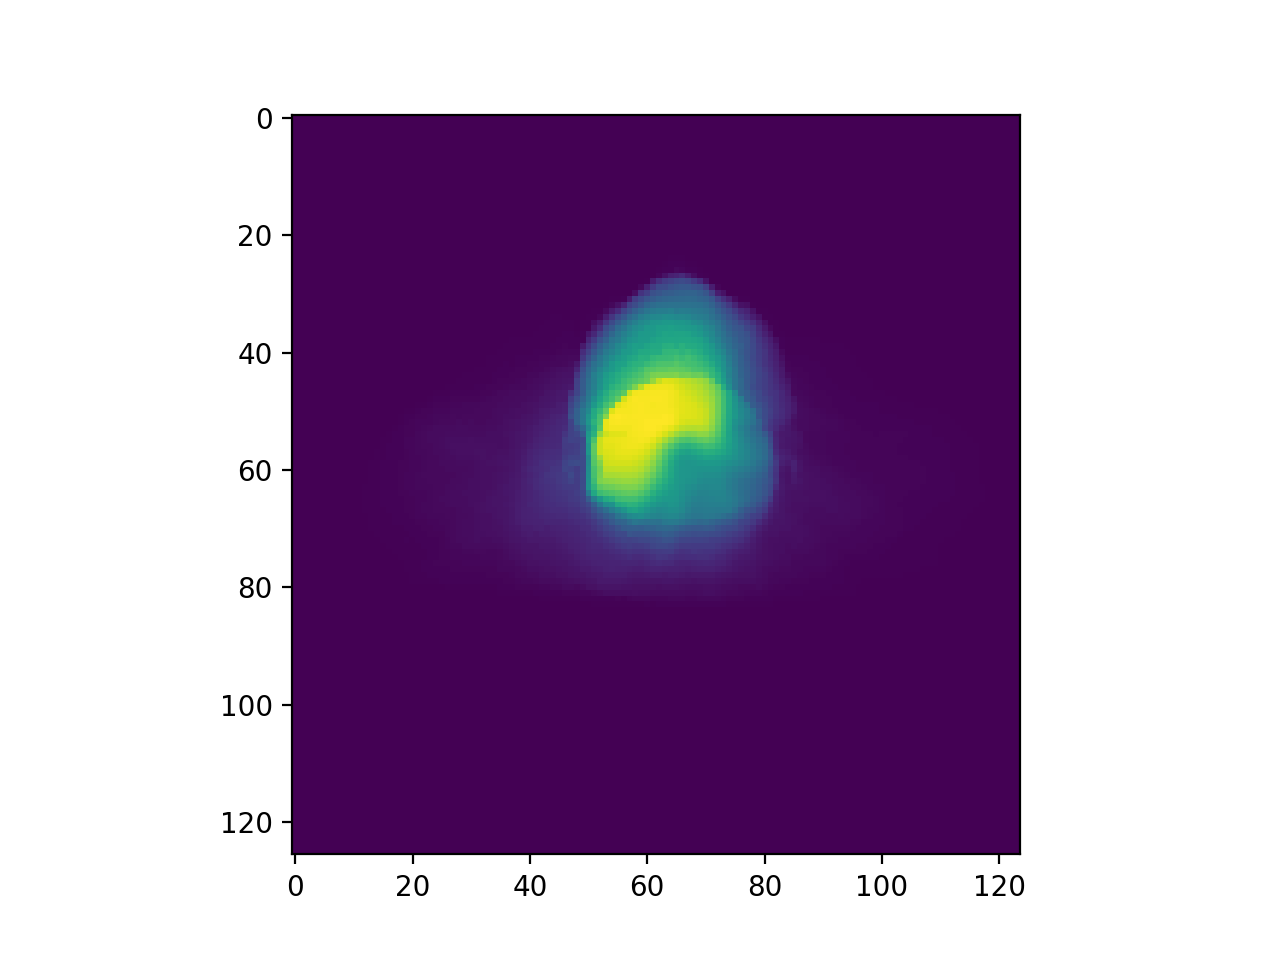
integral_dose_z = np.sum(ds.pixel_array, axis=0)
plt.imshow(integral_dose_z)
plt.imshow(integral_dose_z)
That should get you what you're looking for, I think. Just change axis to 0, 1, and 2 for each dimension.
To view this discussion on the web visit https://groups.google.com/d/msgid/pydicom/CAGLPkGM8XeDd2%2BZimoNwadXkZaoJPz%2BLeLiqHBM4xsk60Z3Cug%40mail.gmail.com.
Suman Gautam
Aug 8, 2022, 1:05:52 PM8/8/22
to pyd...@googlegroups.com
Thank you very much. I really appreciate your help
You guys have amazing platform.
----------------
Regards,
Suman Gautam
PhD Student
Department of Radiation Oncology.
Division of Medical Physics
VIRGINIA COMMONWEALTH UNIVERSITY
|
|
Sender notified by Mailtrack |
| 08/08/22, 01:05:07 PM |

To view this discussion on the web visit https://groups.google.com/d/msgid/pydicom/CAMd1neubpy%2BWwkTMb3vE%2B5WqxH-A7f_A%2B9QHNuoUNk5r-ED_eg%40mail.gmail.com.
Message has been deleted
dan.cu...@gmail.com
Aug 8, 2022, 1:10:52 PM8/8/22
to pydicom
No problem, good luck.
Message has been deleted
dan.cu...@gmail.com
Aug 11, 2022, 7:12:55 PM8/11/22
to pydicom
I recommend perusing scikit-image (https://scikit-image.org/docs/stable/auto_examples/transform/plot_rescale.html) or PIL (https://pillow.readthedocs.io/en/stable/reference/Image.html) python libraries.
On Wednesday, August 10, 2022 at 8:49:37 PM UTC-5 gaut...@vcu.edu wrote:
Hello I have the image of 199x199 shown in the attached below. How can i resize to 96x96.

Suman Gautam
Aug 22, 2022, 10:58:02 AM8/22/22
to pydicom
Hello
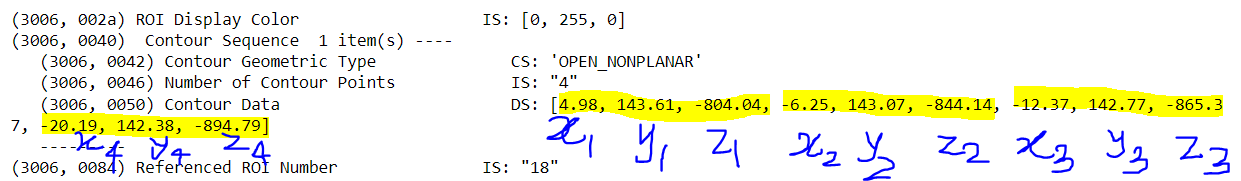
I have the contour data points. I want to plot those points and would like to create a mask by saying that the pixel value inside the contour is 0 and outside is 1. The highlighted points are the contour points in 3D (x,y,z). the pixel dimension is 255, 255, 128 with the pixel sixe of 2.5, 2.5, 3 mm.
Thnak you
Suman Gautam
Oct 3, 2022, 11:13:17 AM10/3/22
to pydicom
How can i create mask for tandem and ovoid?
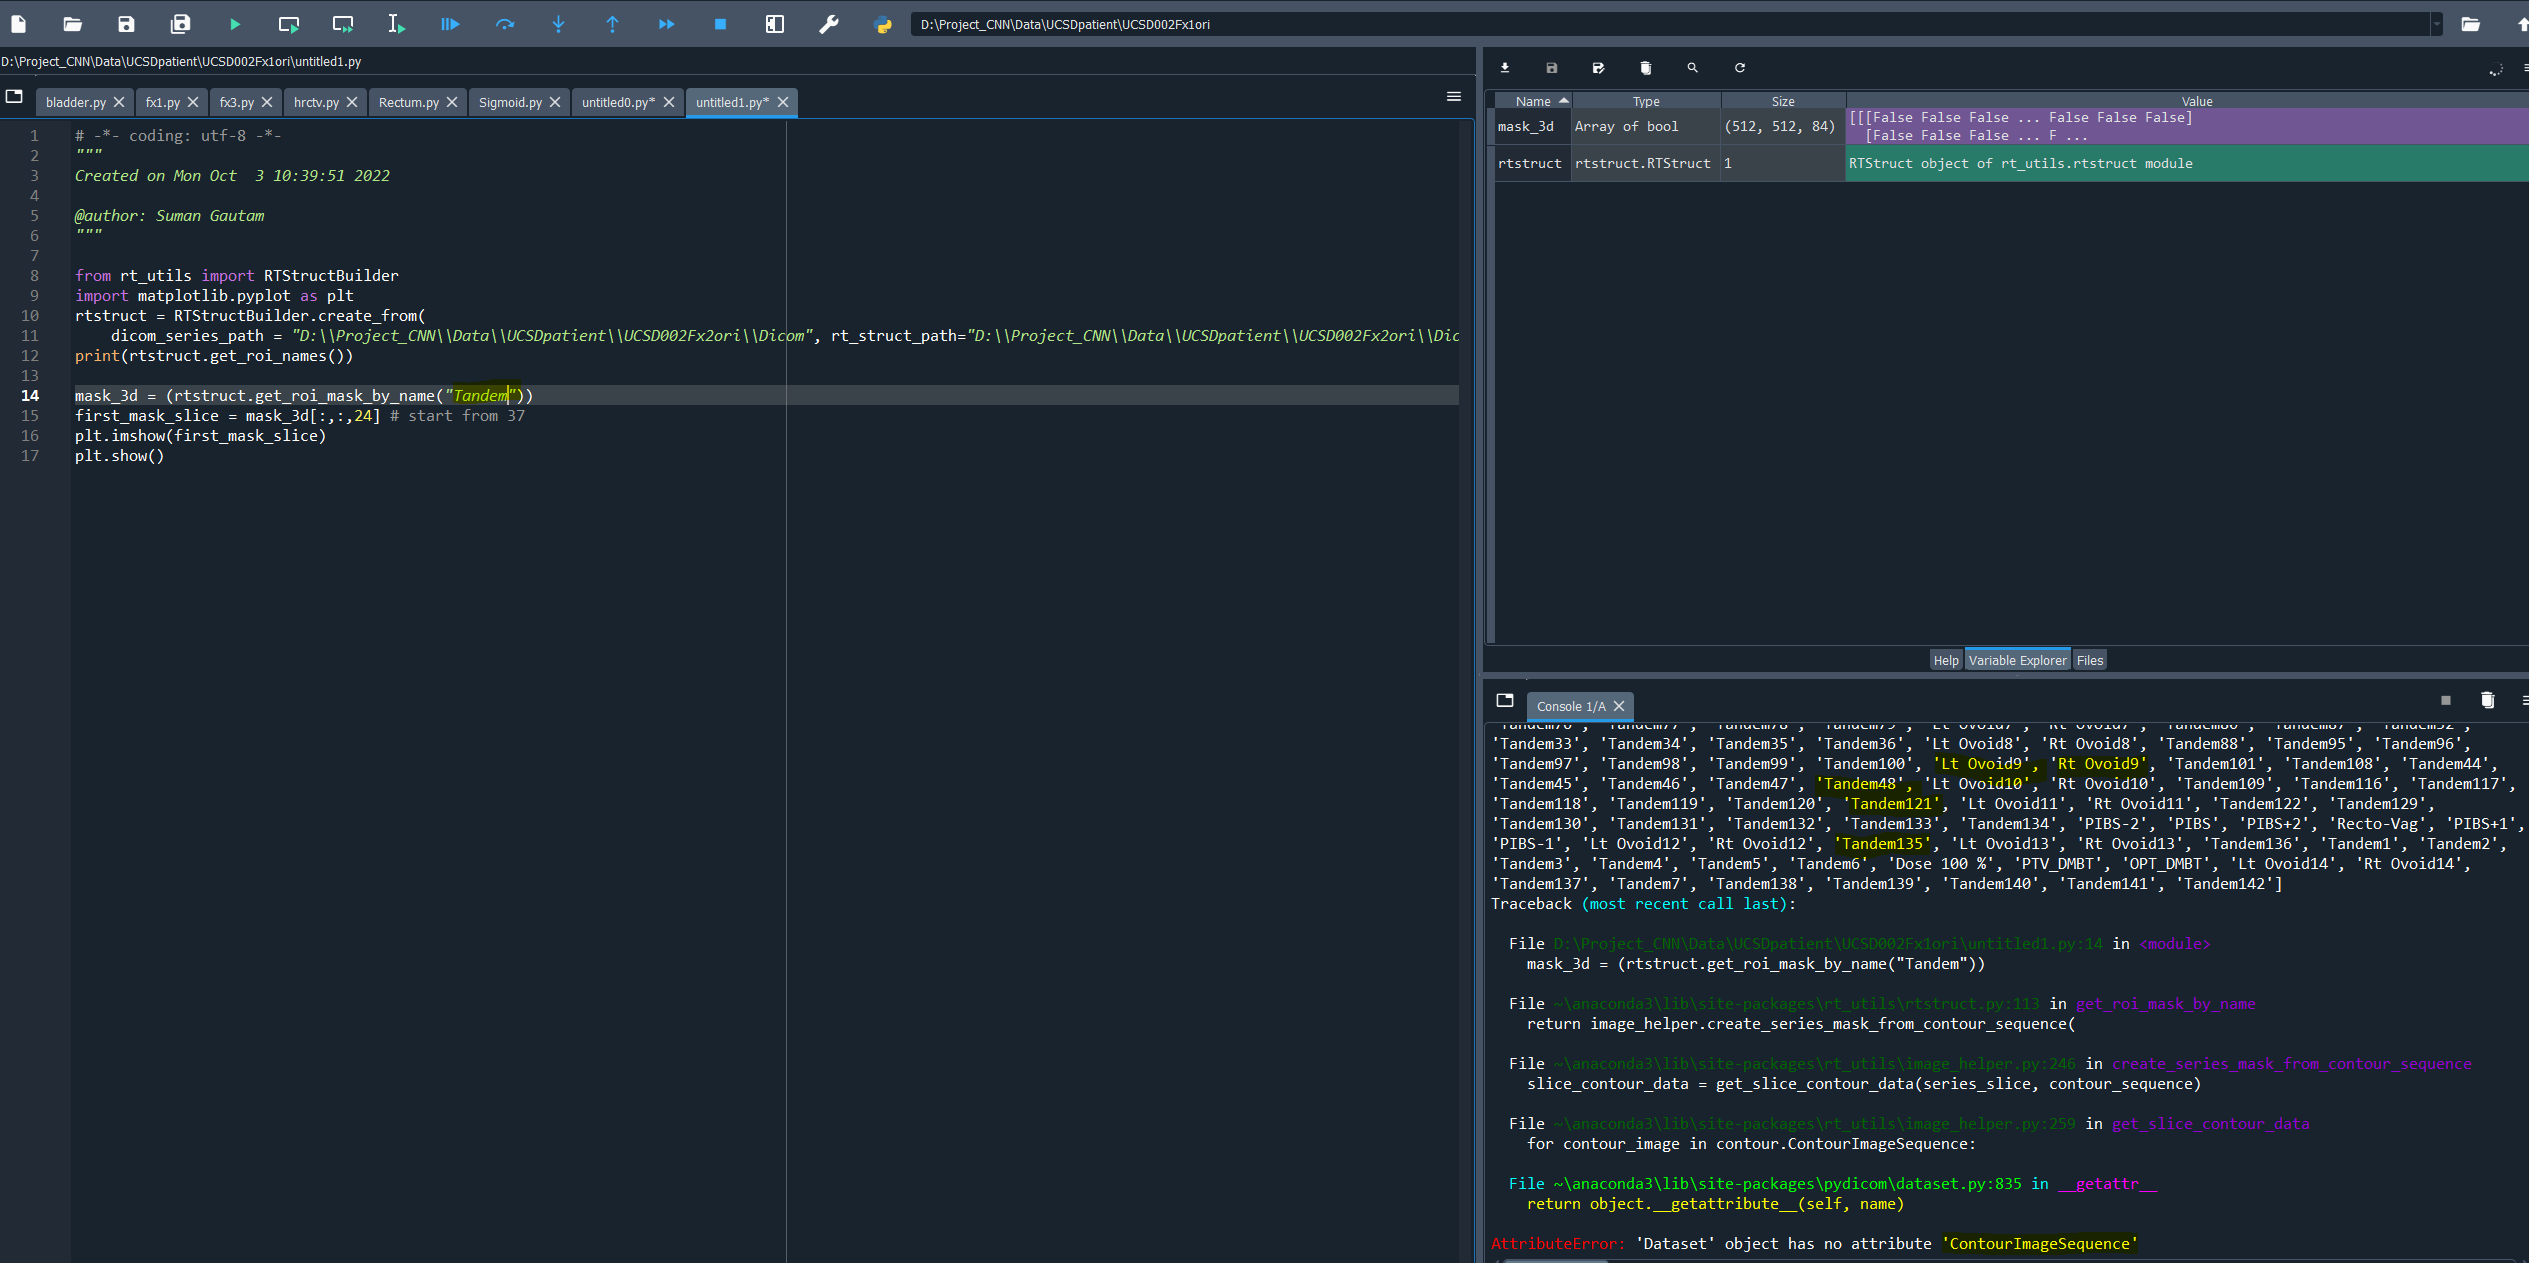
I ahve attached belwo the error.
Suman Gautam
Nov 14, 2022, 8:17:44 PM11/14/22
to pydicom
Hi guys
I want to plot and compare the dose distribution for the clinical plans and the dose predicted plans.
How can i plot ?
thank you

Jeremy Donaghue
Nov 19, 2022, 7:02:19 PM11/19/22
to pyd...@googlegroups.com
You might want to look at pymedphys. They have a gamma function and tutorial
Sent from my iPhone
On Nov 14, 2022, at 8:17 PM, Suman Gautam <gaut...@vcu.edu> wrote:
Hi guys
To view this discussion on the web visit https://groups.google.com/d/msgid/pydicom/7227983e-f48a-46aa-b337-928a3b19e584n%40googlegroups.com.
Reply all
Reply to author
Forward
0 new messages