CAdvisor metric to calculate the average network traffic received by an instance
602 views
Skip to first unread message

Anoop
Jul 13, 2023, 4:56:50 PM7/13/23
to Prometheus Users
Hi,
I am using the metric aws_ec2_network_in_average (exposed by YACE exporter) in Prometheus to display the average network traffic received by an EC2 instance. However, I am checking, if there is any CAdvisor metrics available to replace the cloudwatch metric.
For eg;
How can I replace the below query:
aws_ec2_network_in_average{instance="i-111b8ddf7cb4bf8d1"}
with CAdvisor metric, something like this:
avg(container_network_receive_bytes_total{kubernetes_io_hostname=~"ip-10-XX-XXX-44.us-west-2.compute.internal"}) by (kubernetes_io_hostname)
Kindly share your suggestions on this.
Thanks,

Ben Kochie
Jul 14, 2023, 1:32:50 AM7/14/23
to Anoop, Prometheus Users
I think what you're looking for is node_exporter metrics if you want host level data.
For example, node_network_receive_bytes_total
--
You received this message because you are subscribed to the Google Groups "Prometheus Users" group.
To unsubscribe from this group and stop receiving emails from it, send an email to prometheus-use...@googlegroups.com.
To view this discussion on the web visit https://groups.google.com/d/msgid/prometheus-users/a43a1b21-aff4-4c94-8c25-a3fd961162bbn%40googlegroups.com.
Anoop Mohan
Jul 14, 2023, 7:12:19 PM7/14/23
to Ben Kochie, Prometheus Users
Thanks Ben for responding to my question.


That means, if we write the query like below, I believe it will display the average network traffic received in the last 5 minute for the given node.
sum(rate(node_network_receive_bytes_total{instance=~"ip-10-XX-XXX-44.us-west-2.compute.internal"}[5m])*8 ) by (instance)
When I execute this query in prometheus, it is showing around 550M as the usage.
But, when I check the networkIn usage in AWS console for the same node, it is showing more than 1.34G usage.
So, can someone please explain why it is showing this discrepancy? Please let me know if I am doing something wrong or if the query is not correct.
Thanks,

Brian Candler
Jul 15, 2023, 1:02:30 PM7/15/23
to Prometheus Users
Firstly, you multiplied by 8 to get bits/second, whereas AWS is showing bytes.
Secondly, I *think* AWS shows total transferred in 5 minutes, not rate in bytes per second. If I'm right, then
AWS 1.34GByte per 5 minutes => 4.5MByte/sec => 36Mbit/sec
Thirdly, you have summed over all interfaces, including virtual ones. Try selecting just the external interface.
Anoop Mohan
Jul 17, 2023, 1:59:02 PM7/17/23
to Brian Candler, Prometheus Users
Hi Brian,
I changed the query based on your comments. I think, now the query is showing bytes value instead of bits/second and it is taking only the external interface.
sum(rate(node_network_receive_bytes_total{instance=~"ip-10-XX-XXX-44.us-west-2.compute.internal",device="eth0"}[5m])) by (instance)
When I compare the values now, AWS is still showing 1.36GByte (ie., 1.36GByte per 5 minutes => 4.5MByte/sec). However, the prometheus is showing around 22.5MBytes.

Could you please let me know if there is anything still missing?
Thanks & Regards,
Anoop
To view this discussion on the web visit https://groups.google.com/d/msgid/prometheus-users/15a11964-0560-4c3d-ac30-8ad7a809c449n%40googlegroups.com.
Brian Candler
Jul 17, 2023, 2:59:41 PM7/17/23
to Prometheus Users
To start with, I would take off the sum() to be sure you're not summing over multiple instances or interfaces. That is, try this query instead:
rate(node_network_receive_bytes_total{instance=~"ip-10-XX-XXX-44.us-west-2.compute.internal",device="eth0"}[5m])
Does that give one result, or multiple? If it's multiple then you'll need to investigate why. (For example: is instance=~ matching multiple instances? Are you doing federation so you have multiple copies of the same metric?)
If it's only a single result, and it's still showing around 22.5MB/sec, then you could always escalate to AWS support, to ask them why their traffic metering doesn't matching what is seen at the host. But since AWS is recording traffic levels 5 times lower than what node_exporter sees, you might want to keep it to yourself :-)
The other things I'd do are:
- look at node_network_transmit_bytes_total, and the corresponding AWS transmit metric. Maybe they consider "send" and "receive" the other way round.
- treble-check that you're looking at the same instance
- look at what proportion of packets are broadcast/multicast [compare node_network_receive_packets_total and node_network_receive_multicast_total] - those probably don't count towards ingress/egress totals
- look at what proportion of traffic is going between hosts on the same LAN, e.g. using sniffnet.net. It could be that AWS are only counting Internet ingress traffic, not local traffic.
Personally I'd trust node_exporter more than AWS: that AWS line is suspiciously flat.
Anoop Mohan
Jul 17, 2023, 3:56:44 PM7/17/23
to Brian Candler, Prometheus Users
Thanks Brian for your suggestions.
- I double checked and confirmed that I am comparing the values for the same instance only :)
- Removed the "sum" from the query and confirmed that it is returning only a single row result for the given instance.
- Tried the metric "node_network_transmit_bytes_total", but this result is also showing the values around 26MBytes. AWS console is showing the NetworkOut value 1.38GBytes for the same instance. That means, none of these values are not matching :)


- Checked node_network_receive_packets_total and node_network_receive_multicast_total. These are also not matching with anything :D


- As you mentioned, I might need to check what proportion of traffic is going between hosts on the same LAN.
Meanwhile, I was checking the CAdvsior metrics using the below query to see what network usage it can display for the same host. But this one is showing like 179MBytes.
sum (rate (container_network_receive_bytes_total{kubernetes_io_hostname=~"ip-10-XX-XXX-44.us-west-2.compute.internal",interface="eth0"}[5m])) by (kubernetes_io_hostname)
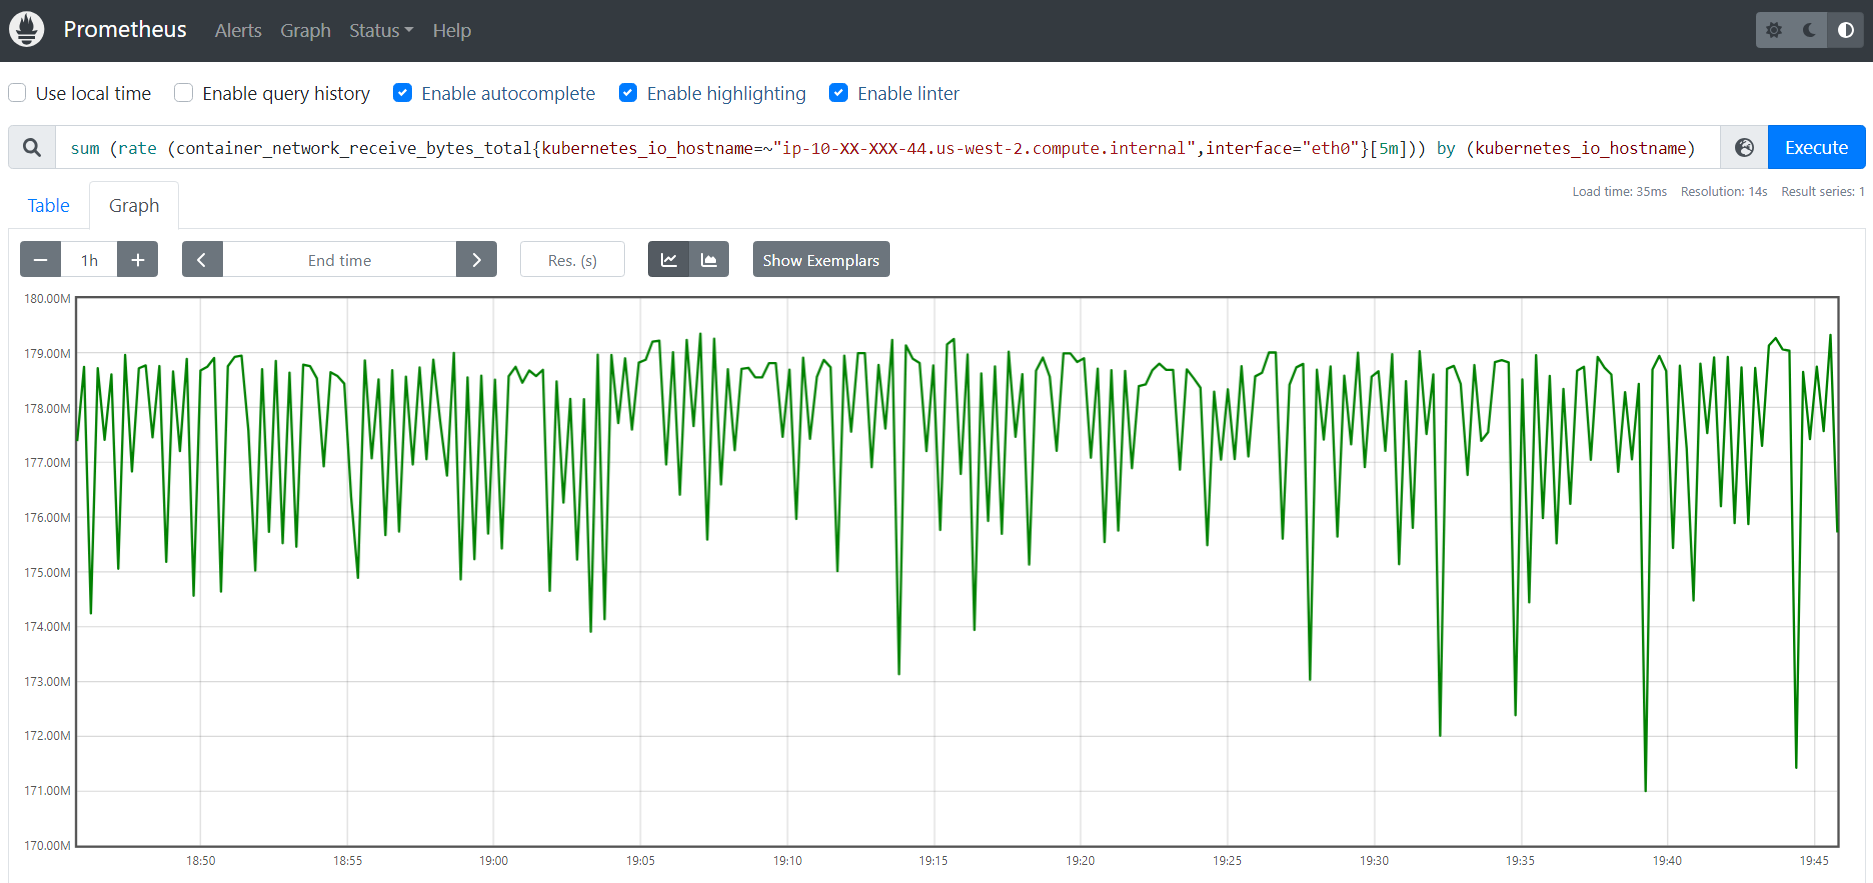
Should it actually match with the node-exporter matric "node_network_receive_bytes_total" result? I am just trying to understand how all these metrics are correlated with.
Any idea why this CAdvisor metric is showing entirely a different result?
Anoop
To view this discussion on the web visit https://groups.google.com/d/msgid/prometheus-users/1c669ffb-9dc2-4288-acd6-337e4a102275n%40googlegroups.com.
Ben Kochie
Jul 17, 2023, 4:27:36 PM7/17/23
to Anoop Mohan, Brian Candler, Prometheus Users
AWS values are per minute, Prometheus rate(...[5m]) is per second, averaged over 5 minutes.
You need to multiply by 60 to get x/min
To view this discussion on the web visit https://groups.google.com/d/msgid/prometheus-users/CAEQqSpc3wXw6zhmDJMyz%2BDfqUr4OoGNpUaeq%2Brmc45i5iqQf9Q%40mail.gmail.com.
Anoop Mohan
Jul 17, 2023, 5:06:37 PM7/17/23
to Ben Kochie, Brian Candler, Prometheus Users
Ahh... ok. That means,
AWS -> Per minute value averaged over 5 minutes = 1.34 GBytes
Prometheus -> Per second rate averaged over 5 minutes = 22.5 MBytes
If that's the case, I believe the calculation would be like; 22.5 * 60 = 1.35 GBytes.
Please let me know if I am calculating it in the wrong way.
If the above calculation is correct, then the node-exporter and AWS values are matching. Thanks a lot for helping me through this.
Any idea why CAdvisor values are not matching with Node-Exporter values?
Thanks & Regards,
Anoop
Reply all
Reply to author
Forward
0 new messages