Mongo DB data exporter
52 views
Skip to first unread message

yegna subramanian
Jan 20, 2022, 6:43:31 PM1/20/22
to Prometheus Users
Hi Team
Nice to connect with you all
I have my data in mongo DB - need to visualize them in grafana through prometheus data source
I have found mongodb-exporter but it scrapes only db metrics and not the data
Nice to connect with you all
I have my data in mongo DB - need to visualize them in grafana through prometheus data source
I have found mongodb-exporter but it scrapes only db metrics and not the data
Please guide on whether an exporter to scrape data is available

Brian Candler
Jan 21, 2022, 3:02:43 AM1/21/22
to Prometheus Users
An "exporter" doesn't really make sense here, because an exporter only returns the value at the current instance in time.
Your options would be:
1. Use the remote read protocol to access data which is stored in MongoDB. However, I don't see any existing MongoDB integration. In any case it would need to understand your Mongo schema to know how timeseries are stored.
2. Scrape the data into prometheus at the same time as you write it into MongoDB (that is, expose the current value in an exporter, and let prometheus scrape it)
3. Use the remote write protocol to write into Prometheus at the same time as you write into MongoDB, perhaps using something like vector.dev
The problem with (2) and (3) is that you're not actually querying the data which is stored in MongoDB at all; you're storing a copy of it in Prometheus.
It sounds to me like Prometheus is the wrong tool for the job here. Either you should be using a grafana datasource which queries MongoDB directly (which I think is perfectly feasible), or you should use a different dashboard tool (e.g. redash).
Brian Candler
Jan 21, 2022, 5:35:00 AM1/21/22
to Prometheus Users
> I have considered the grafana data source option but I found a plugin for mongoDb which is available only in enterprise grafana
>
> So do you suggest me to create a data source for mongoDB in grafana ?
>
> So do you suggest me to create a data source for mongoDB in grafana ?
That's a grafana question, not a prometheus question; it would be better asked in the grafana community.
> And
regarding 2 and 3 - since we use python - Is prometheus-python client
API useful to directly write to prometheus ? (remote write protocol)
If you mean https://github.com/prometheus/client_python, then as far as I know it's only an exporter, not a remote write client. Remote write was option 3. You could send data to vector.dev using one of its many source adapters, and let it do the remote write for you.
In option 2, what I was thinking was that you could expose the data as a regular exporter, at the same time as you write it to MongoDB. Prometheus can then scrape this as normal, i.e. it will scrape the *most recent" updated value only.
yegna subramanian
Jan 21, 2022, 5:37:49 AM1/21/22
to Brian Candler, Prometheus Users
Thank you so much
I have considered the grafana data source option but I found a plugin for mongoDb which is available only in enterprise grafana
So do you suggest me to create a data source for mongoDB in grafana ?
And regarding 2 and 3 - since we use python - Is prometheus-python client API useful to directly write to prometheus ? (remote write protocol)
--
You received this message because you are subscribed to the Google Groups "Prometheus Users" group.
To unsubscribe from this group and stop receiving emails from it, send an email to prometheus-use...@googlegroups.com.
To view this discussion on the web visit https://groups.google.com/d/msgid/prometheus-users/d7c96615-9649-4e01-a2f0-b147ed7ab48cn%40googlegroups.com.
yegna subramanian
Feb 16, 2022, 10:29:50 AM2/16/22
to Brian Candler, Prometheus Users
Hi Brian,
Good day,
I have a code that monitors a drift in data
If drift happens I need to push value 1 to prometheus
Default 0 , issue is when I set gauge as 1, It is 1 till I set it back to 0
Is there any metric where I can push the value 1 and it resets to 0 automatically ?
Good day,
I have a code that monitors a drift in data
If drift happens I need to push value 1 to prometheus
Default 0 , issue is when I set gauge as 1, It is 1 till I set it back to 0
Is there any metric where I can push the value 1 and it resets to 0 automatically ?
Regards,
Yegna
--
You received this message because you are subscribed to the Google Groups "Prometheus Users" group.
To unsubscribe from this group and stop receiving emails from it, send an email to prometheus-use...@googlegroups.com.
To view this discussion on the web visit https://groups.google.com/d/msgid/prometheus-users/a84587cb-9db9-496c-a7f8-e1442c16a8e2n%40googlegroups.com.
Brian Candler
Feb 16, 2022, 1:37:44 PM2/16/22
to Prometheus Users
It sounds like you're attacking this from the wrong direction.
What I believe you want is a counter of drift events. Each time a drift event occurs, you increment the counter. 0 to 1, 1 to 2, 2 to 3 etc. Never reset it to 0. This is the standard and most useful way to handle such data in Prometheus. Using a proper counter also handles edge cases that you might not have considered, such as two of these "drift events" occurring between scrapes.
You can the write queries (e.g. for alerts) which will tell you whether the counter has increased in the last 10 minutes, or the last hour, or whatever. Such things *will* naturally reset to zero. For example, here's an alerting rule I use:
expr: increase(megaraid_pd_shield_counter[72h]) > 0
This gives an alarm whenever the counter has increased; when it *hasn't* increased for 72 hours then the alert is cleared.
P.S. Note that you don't "push" a value to prometheus; prometheus "pulls" a value by scraping the exporter.
yegna subramanian
Feb 16, 2022, 7:10:16 PM2/16/22
to Brian Candler, Prometheus Users
Hi Brian,
Thank you very much for replying
I meant push because I am using pushgateway in python prometheus client
I will definitely consider counter for this
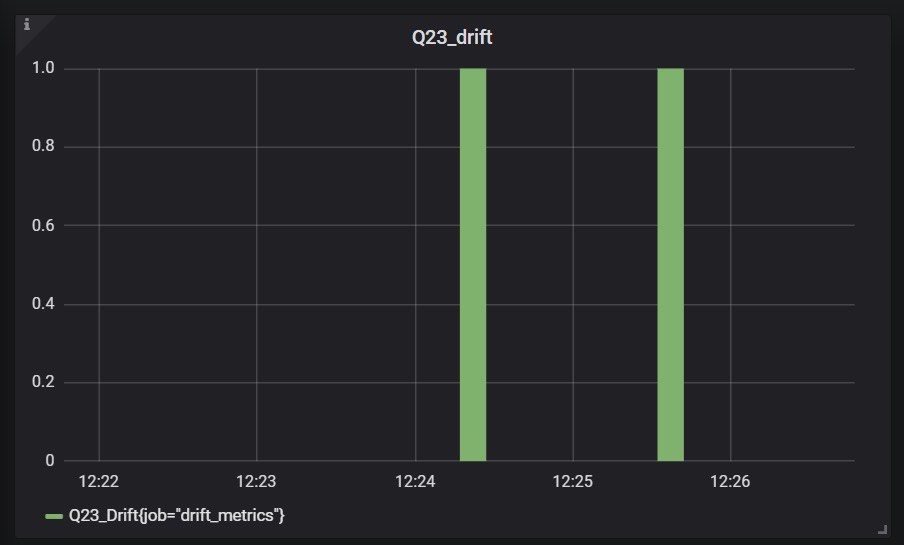
But Out of 3 drifts - I want a spike in bar chart whenever a drift occurs
Like this
Regards,
Yegna
To view this discussion on the web visit https://groups.google.com/d/msgid/prometheus-users/1e9affbe-96b4-4cdd-86e7-2b93543ab117n%40googlegroups.com.
Brian Candler
Feb 17, 2022, 2:17:09 AM2/17/22
to Prometheus Users
That's just a matter of the PromQL query used to visualize the data. Try:
(Q23_counter - Q23_counter offset 1m) >= 0
Another option is increase(Q23_counter[1m]), but since it interpolates the value over the time range given, it won't show values of exactly 1.0
yegna subramanian
Feb 17, 2022, 5:02:31 PM2/17/22
to Brian Candler, Prometheus Users
Wow thats awesome the offset query is working as expected
Thank you
But to push values like pressure or temperature in our use case we need to push model accuracy - we use gauge but till the next push the value is still the previous value
In this scenario the only solution is to set it back to 0 ?
In this scenario the only solution is to set it back to 0 ?
To view this discussion on the web visit https://groups.google.com/d/msgid/prometheus-users/c1a6dff7-c0fc-4281-8293-fa666bccfc67n%40googlegroups.com.
Brian Candler
Feb 17, 2022, 5:07:00 PM2/17/22
to Prometheus Users
On Thursday, 17 February 2022 at 22:02:31 UTC yegnasub...@gmail.com wrote:
But to push values like pressure or temperature in our use case we need to push model accuracy - we use gauge but till the next push the value is still the previous value
That is correct. The value scraped is the last known reading, and that's the right answer.
Push gateway is *not* intended for recording timestamped data. It's designed for picking up data that "hangs around", like the status of a batch job which has terminated. It does not turn prometheus from a pull-gathering to a push-gathering data collection service.
In this scenario the only solution is to set it back to 0 ?
Does the measured temperature really drop down to zero degrees (freezing) in between readings?
yegna subramanian
Feb 17, 2022, 10:56:09 PM2/17/22
to Brian Candler, Prometheus Users
Hi Brian
I used the term temperature for giving an example but exact use case is model accuracy that is pushed for every batch of data
It should not hang around so we set it back to 0 so users can interpret easily per batch
--
You received this message because you are subscribed to the Google Groups "Prometheus Users" group.
To unsubscribe from this group and stop receiving emails from it, send an email to prometheus-use...@googlegroups.com.
To view this discussion on the web visit https://groups.google.com/d/msgid/prometheus-users/e682a8cd-a130-4b98-85a1-54138e8ac5c0n%40googlegroups.com.
Brian Candler
Feb 18, 2022, 2:10:11 AM2/18/22
to Prometheus Users
Prometheus is a time-series database. It records numeric metrics only, and it records them at periodic scrape times. "The value of metric M at time T1 was M1. The value of metric M at time T2 was M2". In other words, it stores *samples* of *continuous* data.
If you want to record details of individual *events* - like attributes belong to a specific batch - then Prometheus is not the right tool for the job. Look at Loki or Elasticsearch/Opensearch instead.yegna subramanian
Mar 3, 2022, 8:15:26 PM3/3/22
to Brian Candler, Prometheus Users
Hi Brian,
Thank you for the clarification
What is the lowest scrape time in Prometheus ?
Can I set it at 0s or 1s ?
Thank you for the clarification
What is the lowest scrape time in Prometheus ?
Can I set it at 0s or 1s ?
To view this discussion on the web visit https://groups.google.com/d/msgid/prometheus-users/60482a7c-71d3-4b35-8013-6a533d701034n%40googlegroups.com.
Brian Candler
Mar 4, 2022, 2:42:44 AM3/4/22
to Prometheus Users
On Friday, 4 March 2022 at 01:15:26 UTC yegnasub...@gmail.com wrote:
What is the lowest scrape time in Prometheus ?
Can I set it at 0s or 1s ?
I scrape time of 0s makes no sense at all. It means you want to do an infinite number of scrapes per second, which means you have infinite amounts of CPU and disk storage.
A scrape time of 1s might be achievable for a very small set of metrics being scraped. However if you think you need 1s scrape times, then prometheus is *probably* the wrong solution for whatever you're trying to do. As I said before: for event logging, use an event logging system instead.
yegna subramanian
Mar 4, 2022, 1:09:40 PM3/4/22
to Brian Candler, Prometheus Users
As you said its only 2 metrics that need to be scraped every 1s and I have total of 7 metrics
But I do not know If we can configure metric scrape interval metric wise.
I presume 7 is ideal to be scrapped at 1s interval right ?
But I do not know If we can configure metric scrape interval metric wise.
I presume 7 is ideal to be scrapped at 1s interval right ?
--
You received this message because you are subscribed to the Google Groups "Prometheus Users" group.
To unsubscribe from this group and stop receiving emails from it, send an email to prometheus-use...@googlegroups.com.
To view this discussion on the web visit https://groups.google.com/d/msgid/prometheus-users/953b8b98-0d08-44a8-9755-1a39dac7d009n%40googlegroups.com.
Brian Candler
Mar 4, 2022, 1:26:05 PM3/4/22
to Prometheus Users
If you feel the need to scrape at one second intervals, then I think you are using prometheus wrongly. However, it's open source software and you are free to use it however you like. It will probably even work.
But I am not going to advise you any further on going down this path, because I think it is ill-advised.
Reply all
Reply to author
Forward
0 new messages