Breaking down the formula for Prometheus cardinality memory requirements
24 views
Skip to first unread message

Aaron Layfield
Mar 12, 2020, 4:52:25 AM3/12/20
to Prometheus Users
I've gone over Brians post here that provides a handy calculator that makes it easy to calculate rough estimates on consumption:
However, I am trying to break this formula down into something I can use outside of the page and I'm struggling a bit. Based on the calculator in the post itself.
Based on the article:
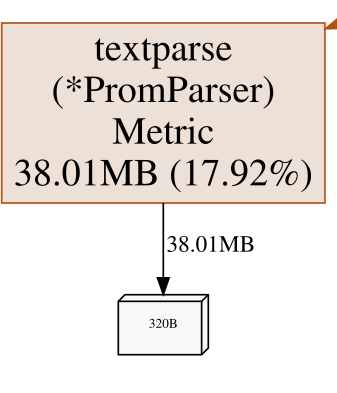
This works out then as about 732B per series, another 32B per label pair, 120B per unique label value and on top of all that the time series name twice. Last, but not least, all of that must be doubled given how Go garbage collection works.
According to the image in the post, time series name (PromParser.Metric) is 320B.
So I'm interpreting this as, based on the default 1,000,000 time series in the calculator (Ignoring Unique Labels as those are negligible):
Avg. Timeseries Size: 732B
# of Series: 1000000
Label Size: 20B (5 Labels)
Timeseries Name: 320B
((732+320+320+100)×2) × 1000000 = 2944000000
This is way above what's suggested (2GB per 1,000,000 records) and I'm certain I'm missing something.
Can someone break this down for me so it makes more sense?
Kind regards,
Aaron

Brian Brazil
Mar 12, 2020, 5:05:10 AM3/12/20
to Aaron Layfield, Prometheus Users
On Thu, 12 Mar 2020 at 08:52, Aaron Layfield <aaron.l...@gmail.com> wrote:
I've gone over Brians post here that provides a handy calculator that makes it easy to calculate rough estimates on consumption:However, I am trying to break this formula down into something I can use outside of the page and I'm struggling a bit. Based on the calculator in the post itself.Based on the article:This works out then as about 732B per series, another 32B per label pair, 120B per unique label value and on top of all that the time series name twice. Last, but not least, all of that must be doubled given how Go garbage collection works.According to the image in the post, time series name (PromParser.Metric) is 320B.So I'm interpreting this as, based on the default 1,000,000 time series in the calculator (Ignoring Unique Labels as those are negligible):Avg. Timeseries Size: 732B# of Series: 1000000Label Size: 20B (5 Labels)Timeseries Name: 320B((732+320+320+100)×2) × 1000000 = 2944000000
I think you're double counting there, and I'm not sure how you're getting 320B for the time series name. The exact formula used (field numbers are off by one) is:
CEIL((fieldname2 * (732 + fieldname3*32 + fieldname3 * fieldname5 * 2) + 120 * fieldname4) * 2 / 1024 / 1024)
So (1000000 * (732 + 5*32 + 5*20*2) + 120 * 0) * 2 = 2184000000
Keep in mind this is for 2.9.2, the numbers will have changed a bit since then.
Brian
This is way above what's suggested (2GB per 1,000,000 records) and I'm certain I'm missing something.Can someone break this down for me so it makes more sense?Kind regards,Aaron
--
You received this message because you are subscribed to the Google Groups "Prometheus Users" group.
To unsubscribe from this group and stop receiving emails from it, send an email to prometheus-use...@googlegroups.com.
To view this discussion on the web visit https://groups.google.com/d/msgid/prometheus-users/56bccff9-4986-4f7c-ab8c-df89f372436a%40googlegroups.com.
Brian Brazil
Aaron Layfield
Mar 12, 2020, 5:38:43 AM3/12/20
to Prometheus Users
Hello Brian,
Thank you, this makes a lot of sense. Lifesaver. I think my confusion came from a combination of:
This statement:
So PromParser.Metric for example looks to be the length of the full timeseries nameThis statement:
and on top of all that the time series name twice
This image:
But reading what you've stated make this all much more sensible and logical. Thank you again!
Regards, Aaron Layfield
On Thursday, 12 March 2020 18:05:10 UTC+9, Brian Brazil wrote:
On Thursday, 12 March 2020 18:05:10 UTC+9, Brian Brazil wrote:
On Thu, 12 Mar 2020 at 08:52, Aaron Layfield <aaron....@gmail.com> wrote:
I've gone over Brians post here that provides a handy calculator that makes it easy to calculate rough estimates on consumption:However, I am trying to break this formula down into something I can use outside of the page and I'm struggling a bit. Based on the calculator in the post itself.Based on the article:This works out then as about 732B per series, another 32B per label pair, 120B per unique label value and on top of all that the time series name twice. Last, but not least, all of that must be doubled given how Go garbage collection works.According to the image in the post, time series name (PromParser.Metric) is 320B.So I'm interpreting this as, based on the default 1,000,000 time series in the calculator (Ignoring Unique Labels as those are negligible):Avg. Timeseries Size: 732B# of Series: 1000000Label Size: 20B (5 Labels)Timeseries Name: 320B((732+320+320+100)×2) × 1000000 = 2944000000I think you're double counting there, and I'm not sure how you're getting 320B for the time series name. The exact formula used (field numbers are off by one) is:CEIL((fieldname2 * (732 + fieldname3*32 + fieldname3 * fieldname5 * 2) + 120 * fieldname4) * 2 / 1024 / 1024)So (1000000 * (732 + 5*32 + 5*20*2) + 120 * 0) * 2 = 2184000000Keep in mind this is for 2.9.2, the numbers will have changed a bit since then.Brian
--This is way above what's suggested (2GB per 1,000,000 records) and I'm certain I'm missing something.Can someone break this down for me so it makes more sense?Kind regards,Aaron
You received this message because you are subscribed to the Google Groups "Prometheus Users" group.
To unsubscribe from this group and stop receiving emails from it, send an email to promethe...@googlegroups.com.
To view this discussion on the web visit https://groups.google.com/d/msgid/prometheus-users/56bccff9-4986-4f7c-ab8c-df89f372436a%40googlegroups.com.
Reply all
Reply to author
Forward
0 new messages