Endpoint Target shows UP in Blackbox but alert shows DOWN and Firing
62 views
Skip to first unread message

Dare Lekan
Jun 21, 2022, 5:14:59 AM6/21/22
to Prometheus Users
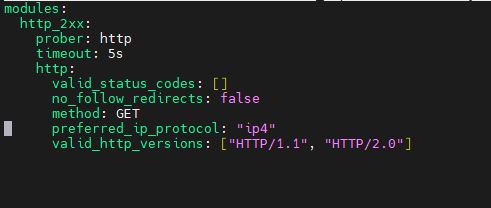
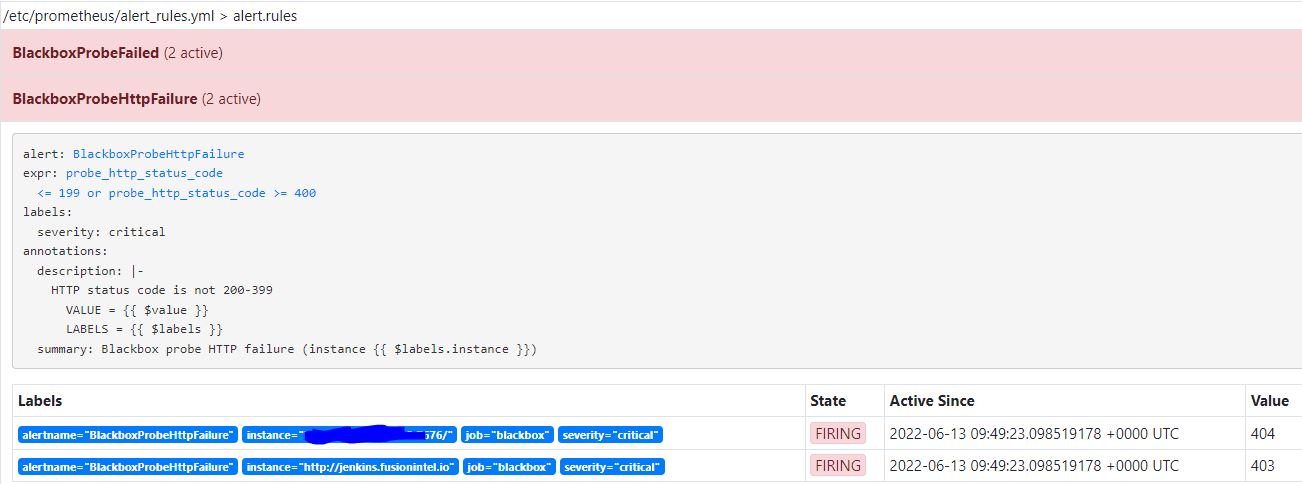
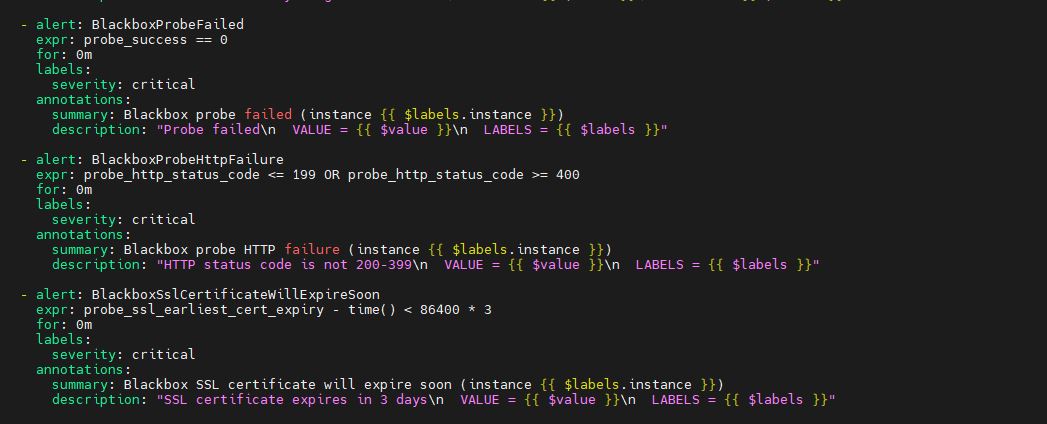
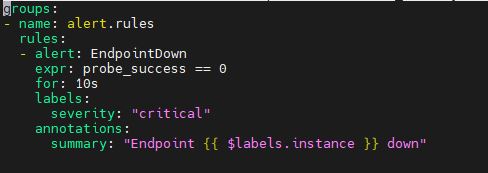
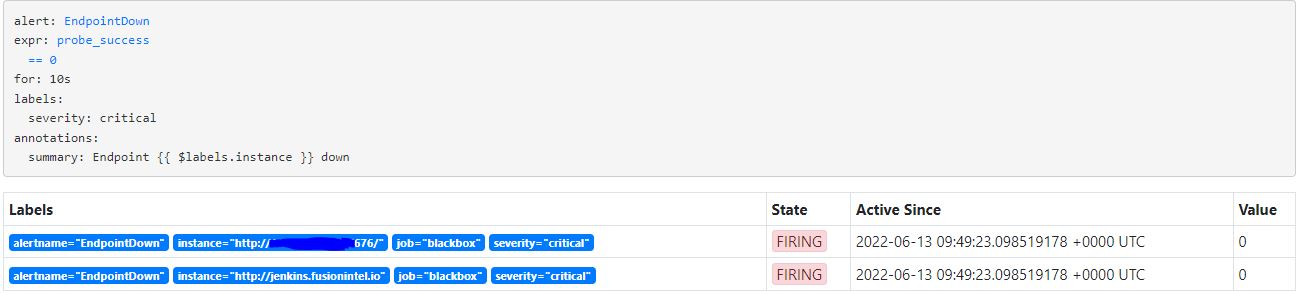
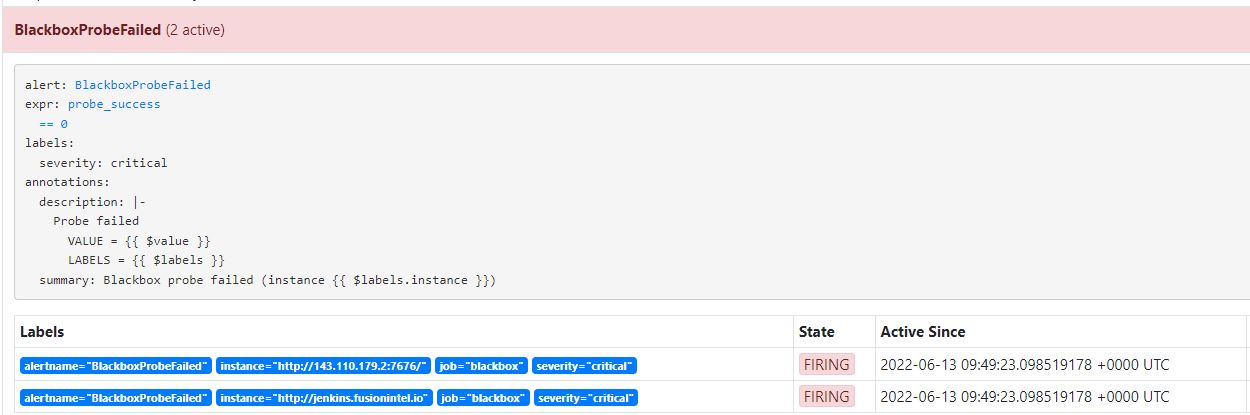
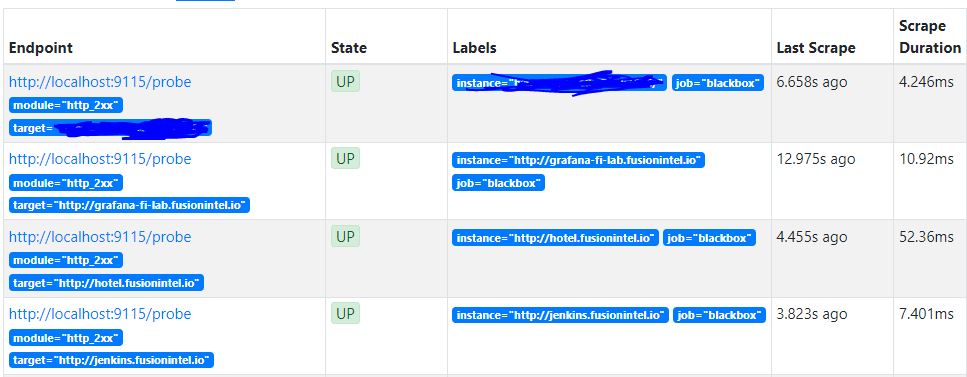
Good day. I am facing a similar issue here. I have alertmanager and blackbox configured. However, both shows different information for same endpoint. What am I doing wrong. Please help.
I have attached screenshot to help in explaining my pain point
I have attached screenshot to help in explaining my pain point

Brian Candler
Jun 21, 2022, 5:50:38 AM6/21/22
to Prometheus Users
"UP" just means that the scrape was successful, i.e. prometheus was able to retrieve metrics from blackbox_exporter. Those metrics may include values like "probe_success 0". Prometheus doesn't mind, it's still a successful scrape.
The easiest way to debug alerting issues is to take your "expr" from your alerting rule - e.g. "probe_success == 0" - and paste it into the Prometheus web interface query box. Wherever you see a graph line, that's where an alert is raised. (The value of the line is irrelevant; it's simply the presence of any value which generates the alert)
Reply all
Reply to author
Forward
0 new messages