Proposing a histogram aggregator
29 views
Skip to first unread message

Tristan Colgate
Feb 8, 2020, 5:35:35 AM2/8/20
to Prometheus Developers
Hi,
I'm been thinking of contributing a histogram aggregator.
The idea is to have an aggregator that takes a set of bucket boundaries. It would return data in the Prometheus histogram format, an le label for each bucket, and a count items less than or equal to that boundary, posiibly with a +Inf.
The goal is to efficiently query data for rendering heat maps, without needing to construct queries for each boundary value.
I'm happy to contribute the work. Would people be interested?

Frederic Branczyk
Feb 8, 2020, 6:31:24 AM2/8/20
to Tristan Colgate, Prometheus Developers
I’ve also written queries and recording rules like this often enough that I feel built in functionality is worth discussing.
--
You received this message because you are subscribed to the Google Groups "Prometheus Developers" group.
To unsubscribe from this group and stop receiving emails from it, send an email to prometheus-devel...@googlegroups.com.
To view this discussion on the web visit https://groups.google.com/d/msgid/prometheus-developers/CAPGZSGKFCvNc1%2BHx-x1PfUvrTJ%2Byy-bs_igt%2BUyN%3DXD3Pf-NHg%40mail.gmail.com.

Julius Volz
Feb 9, 2020, 8:28:32 AM2/9/20
to Frederic Branczyk, Tristan Colgate, Prometheus Developers
So like:
histogram by(mode) (my_cpu_usage, 0.1, 0.5, 0.9)
...would give you the CPU usage histogram (with buckets 0 - 0.1, 0 - 0.5, 0 - 0.9, 0 - Inf) over all cores and machines, split up by mode?
And maybe a histogram_over_time() variant as well?
It sounds interesting to me at least, but I haven't thought much about it.
To view this discussion on the web visit https://groups.google.com/d/msgid/prometheus-developers/CAOs1Umz7ACcQbdv%3D9YY1FpGxgtJbr-91mRwtPj6FDh8qiWntQw%40mail.gmail.com.
Tristan Colgate
Feb 9, 2020, 9:22:32 AM2/9/20
to Julius Volz, Frederic Branczyk, Prometheus Developers
Yes., though histogram([0.2,0.4,..], query) seemed more in line with existing functions (query arg in last position).
My motivation is to plot thing like CPU of all pods as a heat map. Graphing individual pods on a single chart scales badly.
Julius Volz
Feb 9, 2020, 10:32:12 AM2/9/20
to Tristan Colgate, Frederic Branczyk, Prometheus Developers
On Sun, Feb 9, 2020 at 3:22 PM Tristan Colgate <tcol...@gmail.com> wrote:
Yes., though histogram([0.2,0.4,..], query) seemed more in line with existing functions (query arg in last position).
The problem is that we neither have an array data type in PromQL, nor do we support varargs before the last argument.
My motivation is to plot thing like CPU of all pods as a heat map. Graphing individual pods on a single chart scales badly.
Yep, makes sense.
Frederic Branczyk
Feb 9, 2020, 10:45:27 AM2/9/20
to Julius Volz, Prometheus Developers, Tristan Colgate
> The problem is that we neither have an array data type in PromQL, nor do we support varargs before the last argument.
If we agree that we would like a function like this I think this is a solvable thing :)
And yes I do think we should have that and the _over_time version.

Brian Brazil
Feb 9, 2020, 11:29:24 AM2/9/20
to Frederic Branczyk, Julius Volz, Prometheus Developers, Tristan Colgate
You should already be able to do this with bool and or.
To view this discussion on the web visit https://groups.google.com/d/msgid/prometheus-developers/CAOs1Umzs2V3Jjd6e30B0hZw5_Vu-PSUgaLe6%3DNzx4FJvCz-73A%40mail.gmail.com.
Frederic Branczyk
Feb 9, 2020, 1:11:07 PM2/9/20
to Brian Brazil, Julius Volz, Prometheus Developers, Tristan Colgate
We are, but we’re saying this is so tedious it might be worth discussing.
Brian Brazil
Feb 9, 2020, 2:44:26 PM2/9/20
to Frederic Branczyk, Julius Volz, Prometheus Developers, Tristan Colgate
On Sun, 9 Feb 2020 at 18:11, Frederic Branczyk <fbra...@gmail.com> wrote:
We are, but we’re saying this is so tedious it might be worth discussing.
I don't think that the tediousness of a given task is sufficient to determine adding new features, particularly if it's not something that a human that has to type it completely by hand. Novel things that are completely impractical to represent (not merely some repetition) are more interesting from that standpoint.
I'd have a few concerns on this. Firstly there's the syntax question, this would be adding brand new semantics to the PromQL language just to avoid using templating from your configuration management system (or being smart with round and count_values, or quantile/quantile_over_time depending on what output you want).
Secondly, this would be a significant cardinality explosion risk. Right now the most you can ever increase cardinality with PromQL is via absent, and that's only from 0 to 1. This would allow you to multiply the cardinality of the input by the number of buckets - and that could get big fast, especially if we've fancier histograms in future. From a general safety/resilience standpoint I consider this an important property of PromQL.
Thirdly if the concern is indeed tediousness, then what if the user isn't happy with explicitly listing each individual bucket and wants linear/exponential options? That'd add even more functions to PromQL, and even more of a cardinality risk.
I can see the potential uses of this, but the overall complexity plus the cardinality risks do not seem like a good tradeoff for something that's already completely possible today. I don't think trying to remove all repetition/tedium from PromQL queries via changes at the PromQL level is a good strategy, and solving such things at a higher level on top of PromQL is a better option.
Brian

Julien Pivotto
Feb 9, 2020, 2:52:12 PM2/9/20
to Brian Brazil, Frederic Branczyk, Julius Volz, Prometheus Developers, Tristan Colgate
Amazing tools exist like https://promtools.matthiasloibl.com/
Such a tool could be created to meet that histogram need.
--
(o- Julien Pivotto
//\ Open-Source Consultant
V_/_ Inuits - https://www.inuits.eu
Tristan Colgate
Feb 9, 2020, 3:52:41 PM2/9/20
to Julien Pivotto, Brian Brazil, Frederic Branczyk, Julius Volz, Prometheus Developers
Doing this via config management fixes the set of buckets to those chosen by the admins, Vs the users.
Large numbers of features existing in pronql are *redundant" in that label_replace and regexp make the language Turing complete, yet, we have other features becauase implementing a useful tsxb in revgxp would be tiresome and impractical.
It is not a good reason to eschew convenience.
Brian Brazil
Feb 9, 2020, 4:30:01 PM2/9/20
to Tristan Colgate, Julien Pivotto, Frederic Branczyk, Julius Volz, Prometheus Developers
On Sun, 9 Feb 2020 at 20:52, Tristan Colgate <tcol...@gmail.com> wrote:
Doing this via config management fixes the set of buckets to those chosen by the admins, Vs the users.
I'm not getting that distinction, this sounds like something internal to your organisation.
Large numbers of features existing in pronql are *redundant" in that label_replace and regexp make the language Turing complete, yet, we have other features becauase implementing a usethaful tsxb in revgxp would be tiresome and impractical.
label_replace only makes things Turing Complete across multiple recording rule evaluations, so is far less powerful than PromQL in practical terms. It would not be possible to do this feature via label_replace in a single query for example, so the argument doesn't really make sense to me.
We have a few redundant functions for maths/historical reasons (e.g. the addition of the exponentiation operator makes a few previously existing functions questionable), and some to decrease support load (i.e. increase) but these are all no more than minor syntactic sugar. What you're proposing here is very different, as I already described.
Brian
Tristan Colgate
Feb 10, 2020, 1:53:34 AM2/10/20
to Brian Brazil, Julien Pivotto, Frederic Branczyk, Julius Volz, Prometheus Developers
On Sun, 9 Feb 2020, 21:29 Brian Brazil, <brian....@robustperception.io> wrote:
On Sun, 9 Feb 2020 at 20:52, Tristan Colgate <tcol...@gmail.com> wrote:Doing this via config management fixes the set of buckets to those chosen by the admins, Vs the users.I'm not getting that distinction, this sounds like something internal to your organisation.
As in. If I have a grafana dashboard rendering this histogram, I either have a recording rule, which would require a config mgnt change, or a very verbose query which would be considerably more complicated and fragile than a regular user would be comfortable editing.
Adding a bucket, temporarily for explorative reason would be much simpler with a built in aggregation.
I have 3 or 4 charts on each of about a dozen dashboards where this would be useful.
If you have a concise way of producing a bucketed histogram, please do share it.

Bjoern Rabenstein
Feb 10, 2020, 11:33:54 AM2/10/20
to Tristan Colgate, Julius Volz, Frederic Branczyk, Prometheus Developers
On 09.02.20 14:22, Tristan Colgate wrote:
>
> My motivation is to plot thing like CPU of all pods as a heat map. Graphing
> individual pods on a single chart scales badly.
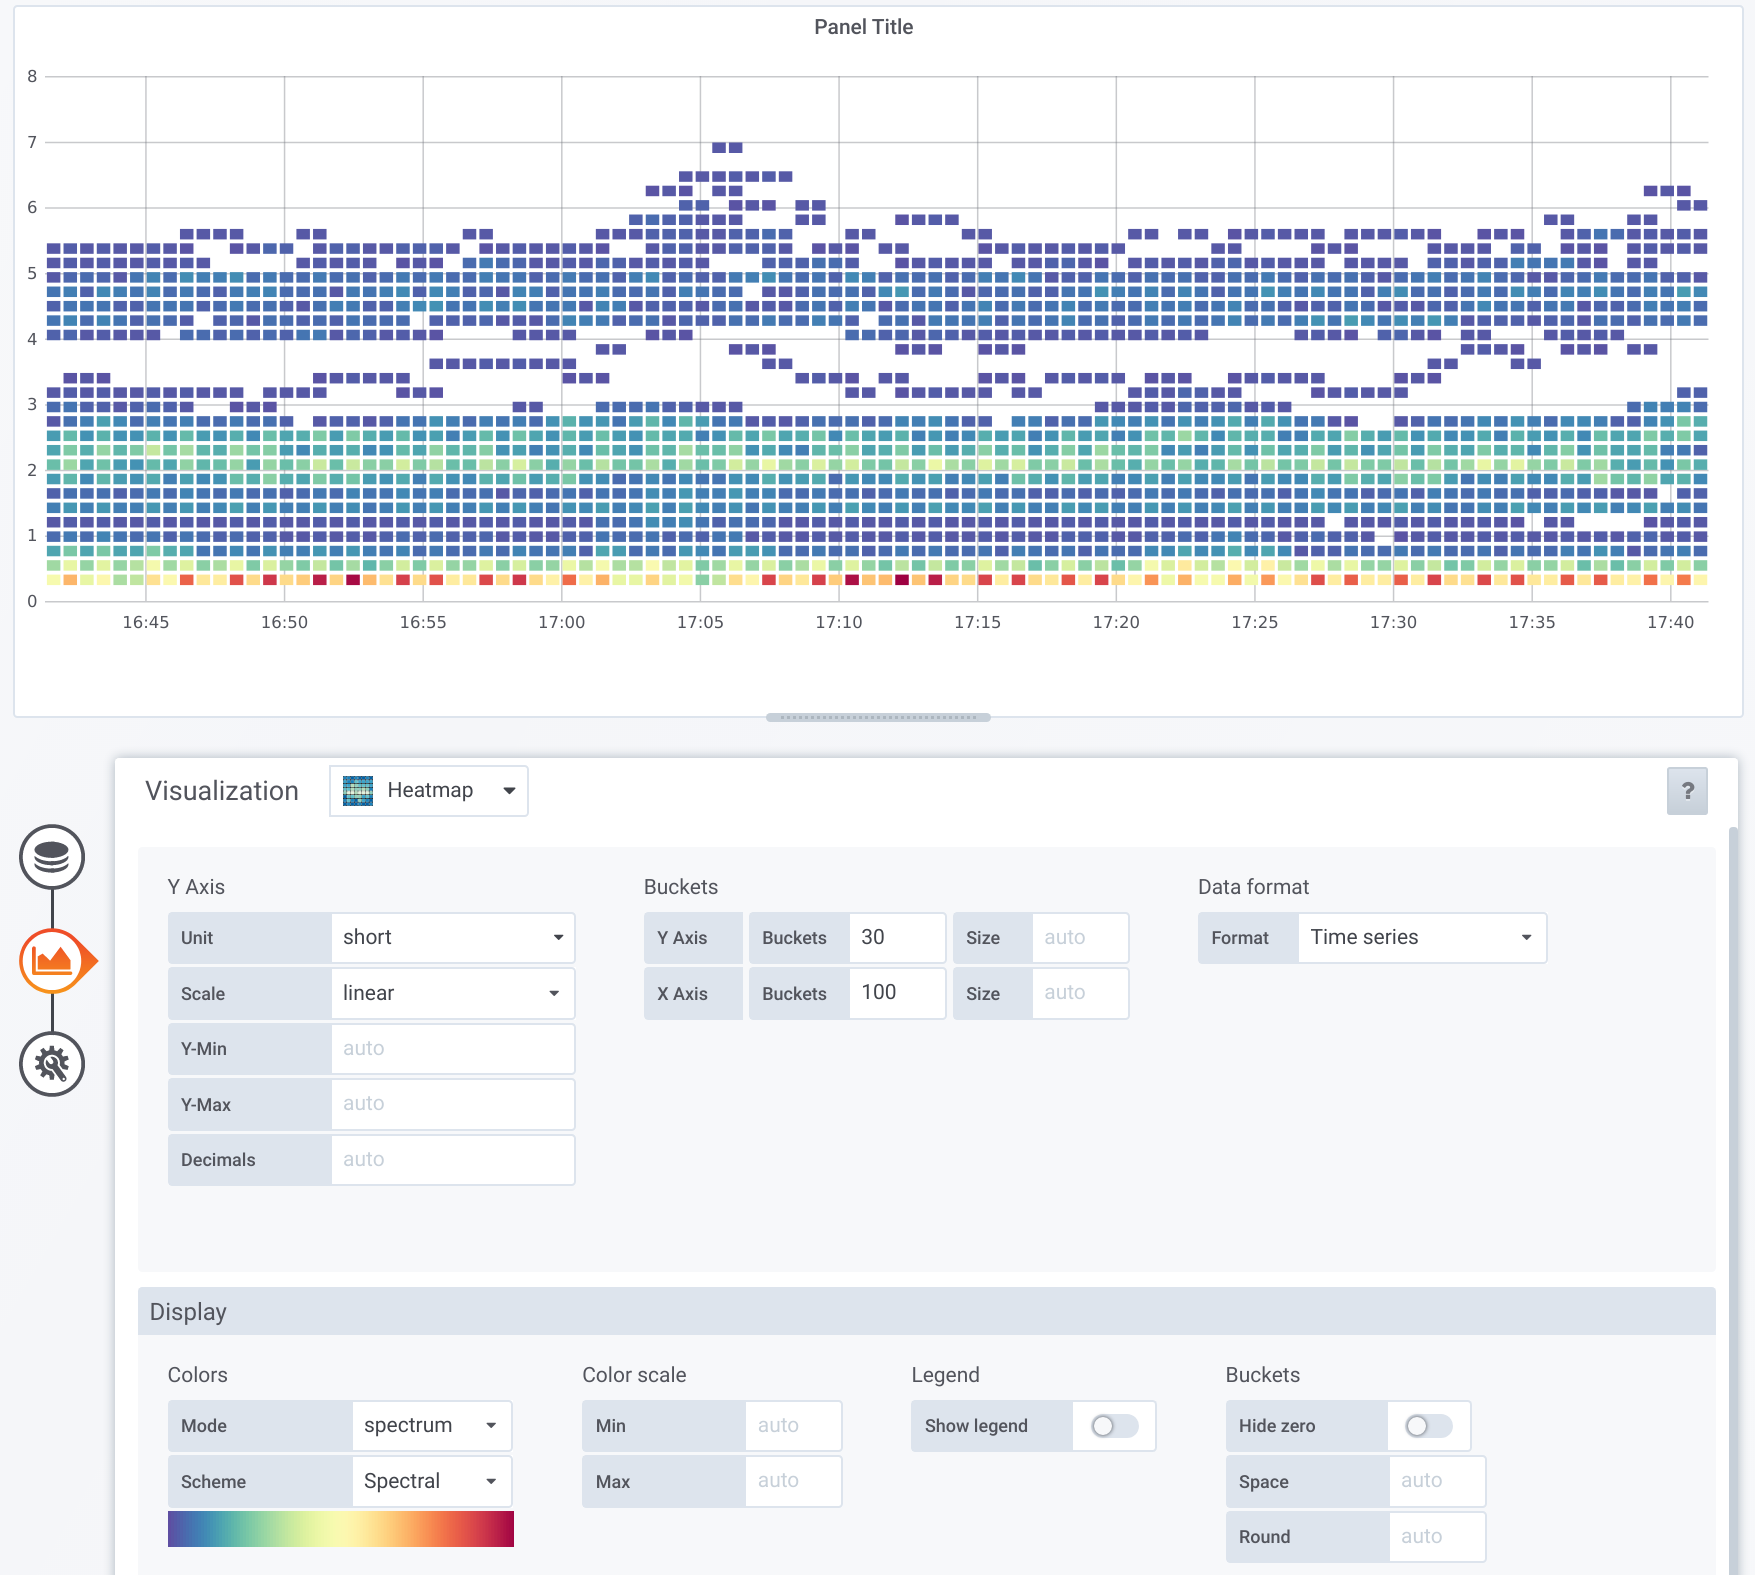
Isn't that already solved from the Grafana side? If you choose the
>
> My motivation is to plot thing like CPU of all pods as a heat map. Graphing
> individual pods on a single chart scales badly.
"Heatmap" visualization and then "Time series" as the "Data format"
option (rather than "Time series buckets"), it should convert a
convoluted panel with many graphs of CPU usage into a heatmap.
It might be quite inefficient that Grafana fetches hundreds or even
thousands of time series and then aggregates them into a heatmap in
your browser, but it certainly works. I have used that quite often for
exactly the purpose of displaying the distribution of CPU usage.
--
Björn Rabenstein
[PGP-ID] 0x851C3DA17D748D03
[email] bjo...@rabenste.in
Björn Rabenstein
Feb 10, 2020, 11:44:09 AM2/10/20
to Bjoern Rabenstein, Tristan Colgate, Julius Volz, Frederic Branczyk, Prometheus Developers
See screenshot. That's CPU usage per container, excluding those below 0.25 (which are most containers).
--
You received this message because you are subscribed to the Google Groups "Prometheus Developers" group.
To unsubscribe from this group and stop receiving emails from it, send an email to prometheus-devel...@googlegroups.com.
To view this discussion on the web visit https://groups.google.com/d/msgid/prometheus-developers/20200210163352.GL2319%40jahnn.
Tristan Colgate
Feb 11, 2020, 1:55:20 AM2/11/20
to Julius Volz, Frederic Branczyk, Prometheus Developers
Would functionss to produce a vector of bucket values avoid syntax changes?
histogram by() (buckets(0.1,0.2..., query)
This has the advantage of allowing alternatives like buckets_linear and buckets_exponential). Extra functions are much less overhead than extra aggregations.
Also, as stated elsewhere, hiatogram_over_time makes sense.
I accidentally replied to Bjoern off-list, to try and say that the number of queries, and volume of data to grafana is a big part of the scalabity problem.
It feels like a fairly natural fit to me.
Julius Volz
Feb 11, 2020, 9:21:58 AM2/11/20
to Tristan Colgate, Frederic Branczyk, Prometheus Developers
On Tue, Feb 11, 2020 at 7:55 AM Tristan Colgate <tcol...@gmail.com> wrote:
Would functionss to produce a vector of bucket values avoid syntax changes?histogram by() (buckets(0.1,0.2..., query)
Did you mean to put closing parens after the bucket list? Otherwise it wouldn't solve the leading varargs issue. But then it seems odd to create a whole time series vector (which buckets() would have to produce, since instant/range vectors are the only list types we support) rather than just a list of scalar bucket boundaries (which we don't support). Would having the buckets as varargs at the end be so bad, given our current language constraints?
Btw. what would that "bool and or" workaround mentioned by Brian look like, so one can get a sense of how tedious that would be?
Tristan Colgate
Feb 11, 2020, 9:45:46 AM2/11/20
to Julius Volz, Frederic Branczyk, Prometheus Developers
sorry, yes, I missed a parenthesis after the ...
Your comment is fair enough, I guess it would require a different type.
Having the buckets as trailing var args would be fine I guess. That
would leave it on the path of having different aggregators for
different bucket functions (or dropping that and only supporting
literally buckets), which would still be useful.
I'll have to defer to Brian on the "bool and or" example.
--
Tristan Colgate-McFarlane
----
"You can get all your daily vitamins from 52 pints of guiness, and a
glass of milk"
Your comment is fair enough, I guess it would require a different type.
Having the buckets as trailing var args would be fine I guess. That
would leave it on the path of having different aggregators for
different bucket functions (or dropping that and only supporting
literally buckets), which would still be useful.
I'll have to defer to Brian on the "bool and or" example.
Tristan Colgate-McFarlane
----
"You can get all your daily vitamins from 52 pints of guiness, and a
glass of milk"
Reply all
Reply to author
Forward
0 new messages