type for metric
已查看 25 次
跳至第一个未读帖子

junior tehe
2019年1月26日 17:28:152019/1/26
收件人 mtail-users
Hello ,
I want to see a graph which go up and go down in my Prometheus, what type with mtail can i use to do this?

Jamie Wilkinson
2019年1月27日 04:09:172019/1/27
收件人 junior tehe、mtail-users
Use the 'gauge' type, rather than counter.
On Sun., 27 Jan. 2019, 09:28 junior tehe, <junior...@gmail.com> wrote:
Hello ,I want to see a graph which go up and go down in my Prometheus, what type with mtail can i use to do this?
--
You received this message because you are subscribed to the Google Groups "mtail-users" group.
To unsubscribe from this group and stop receiving emails from it, send an email to mtail-users...@googlegroups.com.
To post to this group, send email to mtail...@googlegroups.com.
To view this discussion on the web visit https://groups.google.com/d/msgid/mtail-users/99dabed6-467b-4bde-a943-7e2065b05c70%40googlegroups.com.
For more options, visit https://groups.google.com/d/optout.
junior tehe
2019年1月27日 19:17:332019/1/27
收件人 Jamie Wilkinson、mtail-users
I did but results are the same
Jamie Wilkinson
2019年1月27日 22:43:202019/1/27
收件人 junior tehe、mtail-users
The type of the metric reported to Prometheus will be different.
What does your program look like, what is the log input, what are you expecting to see and what do you see instead?
junior tehe
2019年1月28日 09:26:302019/1/28
收件人 Jamie Wilkinson、mtail-users
Hi Jamie,
Here what my program look like:
#nginx_request_total
#counter line_counter by request_status_rp
gauge http_request_total_count by le
#counter http_request_total by le,request_status_rp, request_status_crm
gauge line_time
/^(?P<hostname>[0-9\.-]+)( - -)(?P<timestamp> \[\d{2}\/\w{3}\/\d{4}:\d{2}:\d{2}:\d{2} .\d{4}\])(?P<times> .\w{4} .OjotrehnetI\.ihta. HTTP.\d{1}.\d{1}. )(?P<request_status_rp>\d{3})( \d{3} )(.-. )(.Axis.\d{1}.\d{1}. .-..)(?P<request_time_rp>[+-]?([0-9]*[.])?[0-9]+)(. ..)(?P<request_time_crm>[+-]?([0-9]*[.])?[0-9]+)(. .)(?P<request_status_crm>\d{3})(. "." "\d{2,3}.\d{2,3}.\d{2,3}.\d{2,3}:\d{2,4}.)/{
#Here I count request http where request status code are greater than than 200 and less than 399
$request_status_rp>=200 && $request_status_rp<399{
http_request_total_count["success"]++
}
Here I count request http where request status code are greater than than 400 and less than 599
#request status failed
$request_status_rp>=400 && $request_status_rp<599{
http_request_total_count["Failed_rp"]++
}
#request time < 60s
#request time > 60s
$request_time_rp>=60{
line_time++
}else{
line_time=0
}
}
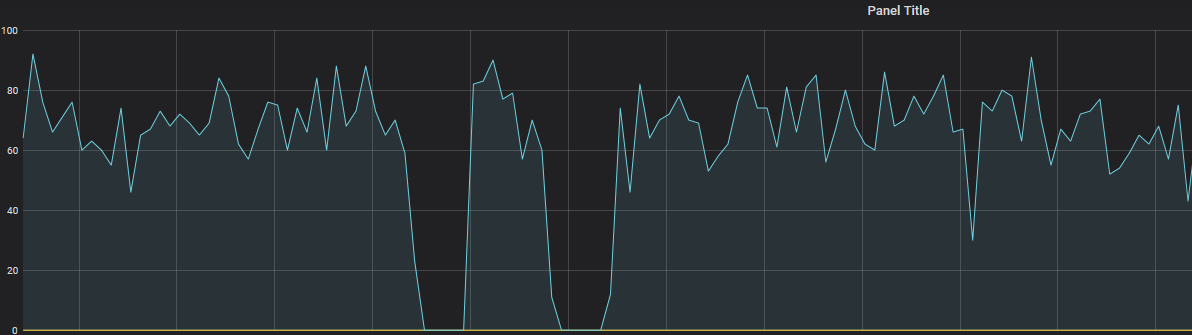
You will find the result in Grafana in attached with file name http
you will find also what I expect to get with file name expect_result
Best regards,
junior tehe
2019年1月28日 09:51:052019/1/28
收件人 Jamie Wilkinson、mtail-users
And also Here metrics scrabed by mtail from log application :
# TYPE http_request_total_count gauge
# http_request_total_count defined at log.mtail:4:9-32
http_request_total_count{le="success",prog="log.mtail"} 49139
# http_request_total_count defined at log.mtail:4:9-32
http_request_total_count{le="Failed_rp",prog="log.mtail"} 8
# http_request_total_count defined at log.mtail:4:9-32
http_request_total_count{le="Failed_crm",prog="log.mtail"} 8
# TYPE line_time gauge
# line_time defined at log.mtail:6:9-17
line_time{prog="log.mtail"} 0
CJohn
2019年3月23日 07:44:482019/3/23
收件人 mtail-users
@junior, eventhough your metrics were defined as guages they are actually working as counters (only addition is happening). From the expected graph, I guess you need to plot the rate of requests. If that is the requirement, then register the metrics as counter in mtail. Then in graph, use the "rate()" functon of prometheus.
For ex.
to view the rate of successful requests the query will be like this:
rate(http_request_total_count{le="success",prog="log.mtail"}[5m])--
Thanks,
回复全部
回复作者
转发
0 个新帖子