Global Lock for more than 4 minutes on Mongo 3.0 with wiredTiger
![Abhishek Amberkar [अभिषेक]'s profile photo](http://lh3.googleusercontent.com/a-/ALV-UjX_kr81MFTd_PijEQf22t_QKS_cBQGc7ZuX1Dg8RVRf9M0mYiQ=s40-c)
Abhishek Amberkar [अभिषेक]
The setup
I am running a replica set in production without sharding. All nodes are
The data
I have around 4TB worth of data on each node (MMAPv1), with close to 7000
The plan
I decided to upgrade to 3.2 and as an intermediate step, I have to upgrade to
3.0 first. So to start with that, I added the aforementioned hidden member to
the existing replica set. I started sending prod like read query traffic to this
to prod like pattern.
The observation
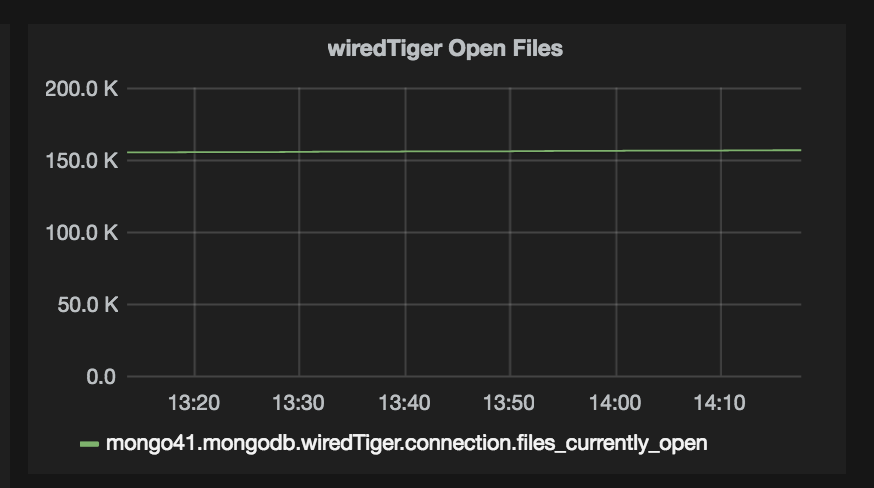
As expected, wiredTiger ended up creating huge number of files, the number is
close to 600k, with number of open files at any given time close to 150k. This
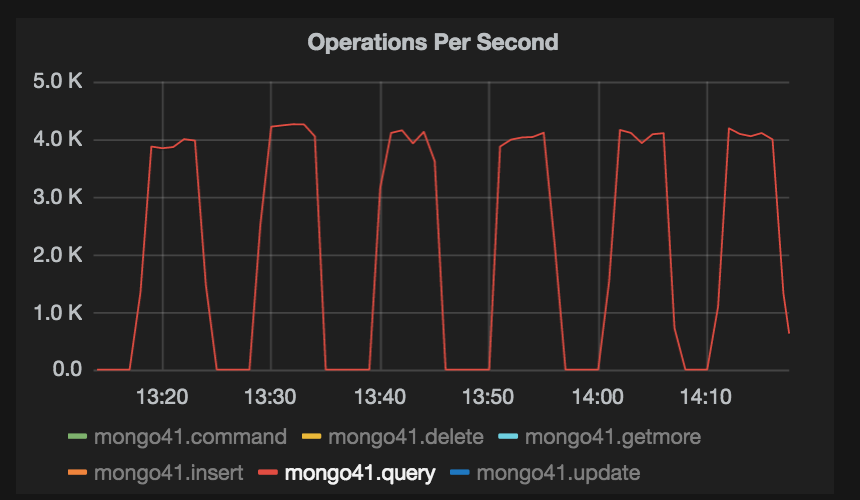
node could handle upto 4k queries per second, but I saw a drop in traffic, from
4k RPS to 0 (zero) after every 4 to 5 minutes. This behaviour was observed for
In the process of understanding what exactly is happening, I ran db.currentOp()
rs01:SECONDARY> db.currentOp({"secs_running" : { $exists: true}})
{
"inprog" : [
{
"desc" : "conn2640",
"threadId" : "0xa2a763ba0",
"connectionId" : 2640,
"opid" : 15958259,
"active" : true,
"secs_running" : 255,
"microsecs_running" : NumberLong(255666599),
"op" : "query",
"ns" : "<db_name>.<collection_name>",
"query" : {
"$orderby" : { "placeholder" : NumberLong(-1) },
"$query" : {
"placeholder" : { "$in" : [ "placeholder" ] },
"placeholder" : "placeholder",
"$or" : [
{
"placeholder" : {
"$gt" : ISODate("2016-03-08T05:54:35.977Z")
}
}
],
"placeholder" : "placeholder"
}
},
"client" : "<some_ip>:34210",
"numYields" : 1,
"locks" : { "Global" : "r" },
"waitingForLock" : true,
"lockStats" : {
"Global" : {
"acquireCount" : { "r" : NumberLong(3) },
"acquireWaitCount" : { "r" : NumberLong(1) },
"timeAcquiringMicros" : { "r" : NumberLong(255561934) }
},
"Database" : { "acquireCount" : { "r" : NumberLong(1) } },
"Collection" : { "acquireCount" : { "r" : NumberLong(1) } }
}
},
{
"desc" : "repl writer worker 5",
"threadId" : "0x15738ca80",
"opid" : 15958268,
"active" : true,
"secs_running" : 255,
"microsecs_running" : NumberLong(255634829),
"op" : "none",
"ns" : "<db_name>.<collection_name>",
"query" : { },
"numYields" : 0,
"locks" : {
"Global" : "w",
"Database" : "w",
"Collection" : "w"
},
"waitingForLock" : false,
"lockStats" : {
"Global" : { "acquireCount" : { "w" : NumberLong(1) } },
"Database" : { "acquireCount" : { "w" : NumberLong(1) } },
"Collection" : { "acquireCount" : { "w" : NumberLong(1) } }
}
}
]
}
Here you can see two operations are "in progress". First one is a query, which
is "waiting for lock" for whooping 255 seconds, whereas another is a "repl
writer worker thread", which is again running for 255 seconds and holding
Global, Database and Collection level lock with "w" (Intent Exclusive) mode.
This behaviour is reflected in the graph below.
From the docs here,
https://docs.mongodb.org/v3.0/faq/concurrency/#how-does-concurrency-affect-secondaries
I understand that
"In replication, MongoDB does not apply writes serially to secondaries.
Secondaries collect oplog entries in batches and then apply those batches in
parallel. Secondaries do not allow reads while applying the write operations,
and apply write operations in the order that they appear in the oplog."
That explains why lock is present, but I am yet to understand why is it taking
more than 4 minutes to finish.
I would appreciate if you guide me in the right direction to understand what
exactly is happening here.
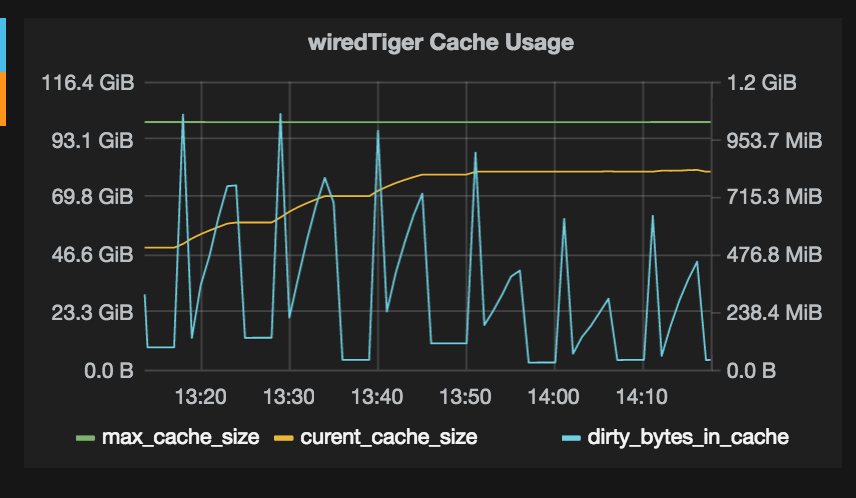
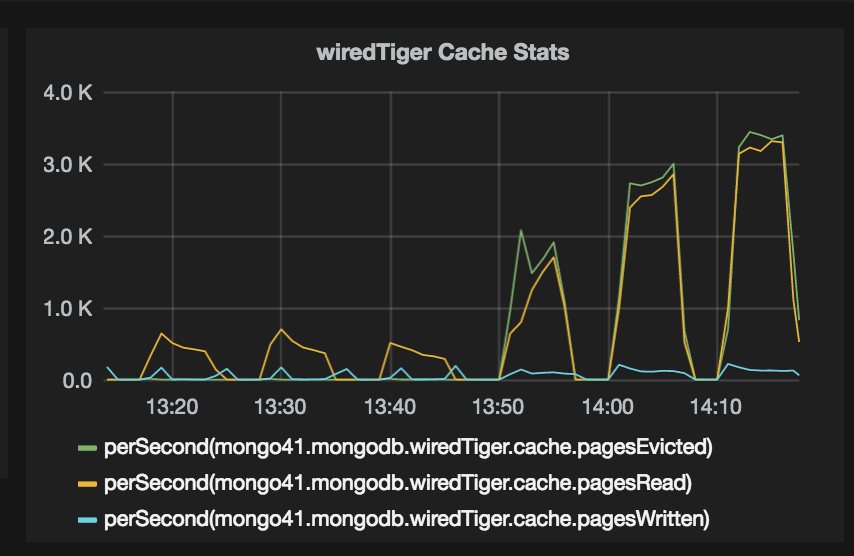
I am attaching some more wiredTiger stats charts. Let me know if more
information is required.
Thanks.
--
With Regards
Abhishek Amberkar

Kevin Adistambha
Hi Abhishek
I decided to upgrade to 3.2 and as an intermediate step, I have to upgrade to
3.0 first. So to start with that, I added the aforementioned hidden member to
the existing replica set. I started sending prod like read query traffic to this
node to check if it will be able to withstand that much load. I did this for over
a week.
In general, you cannot get reliable load testing results if you are using Secondary reads. A hidden Secondary is only different compared to a non-hidden Secondary in their ability to be elected Primary.
A Secondary’s goal is to replicate the Primary’s oplog as quickly as it can, so that it can take over the Primary’s job at a moment’s notice. For this reason, a Secondary perform writes in a very different manner compared to the Primary. This is described in the page How does concurrency affect secondaries that you have seen, where it says “Secondaries do not allow reads while applying the write operations“. Therefore, your load testing is creating a resource contention on this Secondary, and you are seeing the effect of this resource contention in your observations.
If you need to perform a load test, I would suggest creating a separate replica set and routing the operations to both production set and the testing set, which will give you a more accurate comparison.
You could also look into using a community tool like Flashback (https://github.com/ParsePlatform/flashback), which captures and replays MongoDB workload.
Best regards,
Kevin
Abhishek Amberkar
You could also look into using a community tool like Flashback (https://github.com/ParsePlatform/flashback), which captures and replays MongoDB workload.
Kevin Adistambha
Hi Abhishek
I should have specified that I used Flashback to do this. I had also mentioned that I am sending prod like traffic, but with Flashback, I am sending the actual prod traffic to this hidden node. My workload is read heavy, so 90% of my traffic is reads and using secondary preference I am sending all that traffic to secondaries. And via Flashback, that same traffic gets replayed on 3.0 node.
Let me understand this correctly:
- Your current prod setup consists of three nodes, and your application uses Read Preference of secondaryPreferred
- Currently you are testing MongoDB 3.0 using the WiredTiger engine, set it up as a hidden Secondary, and use Flashback to replay all traffic to the Primary
- Your prod traffic is 90% reads, and 10% upserts
- I presume you send only the read traffic to the 3.0 node, since Secondaries cannot perform writes
Please let me know if my understanding of the situation is incorrect.
With that information, do you still think that this “load testing” is creating a resource contention?
If my understanding is correct, there are different factors at play in this setup:
- Currently in your prod system, the read traffic is probably spread across the three 2.6 nodes
- If you are sending all read traffic to the 3.0 node, that node could be overburdened since:
- It must also act as a Secondary, with the aforementioned limitation (i.e. reads will block on it during oplog application)
- Load that were likely spread across three nodes are now concentrated on this single node
- The high WiredTiger cache eviction rate could mean that it frequently need to go to disk to satisfy the read queries because your working set does not fit in RAM, further degrading performance
- The WiredTiger cache seems to be configured at 1 GB. How much RAM does this 3.0 machine has? Was the WiredTiger cache size deliberately set to 1 GB, or was it left at default?
There are some things that maybe you could try:
- Since this is a load testing exercise, data integrity during the test is less important vs. the ability of the server to handle load. You could remove the 3.0 node from the prod replica set, configure it as a new single-node replica set, and use Flashback to simulate your prod load (both read and write) on it
- However, a more representative load testing is using an actual three-node 3.0 replica set that mirrors your prod deployment. Using this testing setup, you could also test failure scenario under load (e.g. what happens when a Secondary went offline during heavy read load)
Having said that, please be advised that using Secondary read to provide extra capacity for reads is generally not recommended. For more details regarding this, please see Can I use more replica nodes to scale blog post.
Best regards,
Kevin
Abhishek Amberkar
Replying inline.
On Thursday, May 5, 2016 at 7:41:44 AM UTC+5:30, Kevin Adistambha wrote:
Hi Abhishek
I should have specified that I used Flashback to do this. I had also mentioned that I am sending prod like traffic, but with Flashback, I am sending the actual prod traffic to this hidden node. My workload is read heavy, so 90% of my traffic is reads and using secondary preference I am sending all that traffic to secondaries. And via Flashback, that same traffic gets replayed on 3.0 node.
Let me understand this correctly:
- Your current prod setup consists of three nodes, and your application uses Read Preference of secondaryPreferred
- Currently you are testing MongoDB 3.0 using the WiredTiger engine, set it up as a hidden Secondary, and use Flashback to replay all traffic to the Primary
- Your prod traffic is 90% reads, and 10% upserts
- I presume you send only the read traffic to the 3.0 node, since Secondaries cannot perform writes
Please let me know if my understanding of the situation is incorrect.
With that information, do you still think that this “load testing” is creating a resource contention?
If my understanding is correct, there are different factors at play in this setup:
- Currently in your prod system, the read traffic is probably spread across the three 2.6 nodes
- If you are sending all read traffic to the 3.0 node, that node could be overburdened since:
- It must also act as a Secondary, with the aforementioned limitation (i.e. reads will block on it during oplog application)
- Load that were likely spread across three nodes are now concentrated on this single node
- The high WiredTiger cache eviction rate could mean that it frequently need to go to disk to satisfy the read queries because your working set does not fit in RAM, further degrading performance
- The WiredTiger cache seems to be configured at 1 GB. How much RAM does this 3.0 machine has? Was the WiredTiger cache size deliberately set to 1 GB, or was it left at default?
There are some things that maybe you could try:
- Since this is a load testing exercise, data integrity during the test is less important vs. the ability of the server to handle load. You could remove the 3.0 node from the prod replica set, configure it as a new single-node replica set, and use Flashback to simulate your prod load (both read and write) on it
- However, a more representative load testing is using an actual three-node 3.0 replica set that mirrors your prod deployment. Using this testing setup, you could also test failure scenario under load (e.g. what happens when a Secondary went offline during heavy read load)
Having said that, please be advised that using Secondary read to provide extra capacity for reads is generally not recommended. For more details regarding this, please see Can I use more replica nodes to scale blog post.

Sarat Devineni
Were you able to solve the issue?
Thanks,
S
Kevin Adistambha
Hi Sarat
Were you able to solve the issue?
Do you have an issue that superficially resembles this? If yes, please create a new thread with:
- What is your issue in detail
- What is your exact MongoDB version, and your OS version
- What is your topology (standalone, replica set, sharded cluster)
- Any error message you’re seeing, and what have you tried to fix them
Although your issue may look similar, the cause is frequently very different.
Best regards
Kevin
Abhishek Amberkar
We reduced nsSize to 1mb and switched to mmapv2
This is totally based on our workload, so might not be helpful to you. Please evaluate first :)