Concurrent requests clogs single apache process
27 views
Skip to first unread message

Scott McConnell
Sep 17, 2020, 1:55:52 AM9/17/20
to modwsgi
Hello, I am using apache/mod_wsgi to serve a processor/ajax heavy Django application on an Ubuntu 16.04 machine. The app is working with low traffic on https (~1 sec response time), but I'm running into a bottleneck during load testing.
During a load test (15 concurrent requestors) response time becomes ~6 sec, but CPU utilization peaks at 30% according to CloudWatch. I am using an EC2 instance and I've been continually increasing the size with no effect (now using c5.xlarge).
The strange part is my htop output... one process is taking the majority of the CPU time, whereas the wsgi daemon processes don't seem to take on any tasks. This culprit process starts after I restart the server and never dies until the server is stopped.
This was the output when I tried tracing the process:
$ sudo strace -p 14645
strace: Process 14645 attached
restart_syscall(<... resuming interrupted restart_syscall ...>
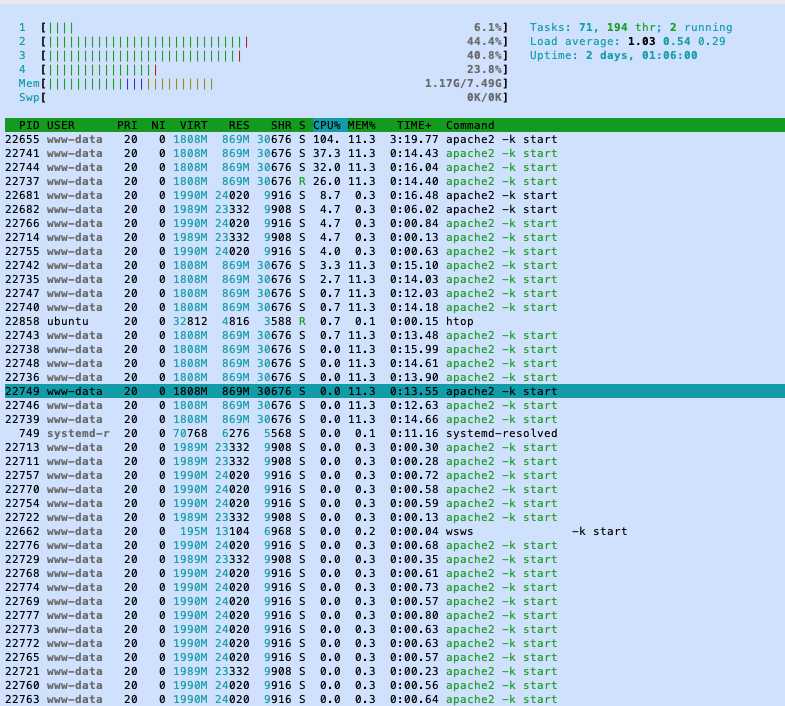
Below are some htop screenshots, and I pasted my config at the bottom.
When sorted by CPU utilization:
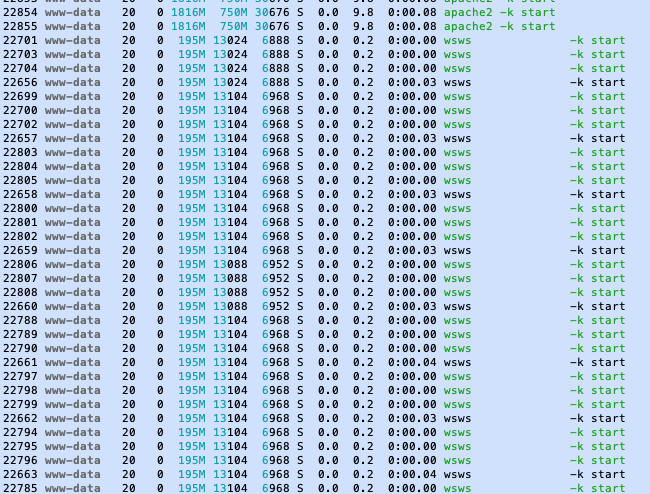
then all the way at the bottom are my daemon processes named wsws:
Here is my mysite.com.conf:
<VirtualHost *:80>
ServerAdmin webmaster@localhost
ServerName mysite.com
ServerAlias www.mysite.com
DocumentRoot /var/www/html
ErrorLog ${APACHE_LOG_DIR}/error.log
CustomLog ${APACHE_LOG_DIR}/access.log combined
LogLevel info
<Directory /home/ubuntu/myrepo/mysite/static>
Require all granted
</Directory>
<Directory /home/ubuntu/myrepo/mysite/mysite>
<Files wsgi.py>
Require all granted
</Files>
</Directory>
WSGIDaemonProcess mysite python-path=/home/ubuntu/myrepo/mysite python-home=/home/ubuntu/myrepo/venv processes=25 threads=1 display-name=wsws request-timeout=60 inactivity-timeout=600
WSGIProcessGroup mysite
WSGIScriptAlias / /home/ubuntu/myrepo/mysite/mysite/wsgi.py
WSGIApplicationGroup %{GLOBAL}
RewriteEngine on
RewriteCond %{SERVER_NAME} =www.mysite.com [OR]
RewriteCond %{SERVER_NAME} =mysite.com
RewriteRule ^ https://%{SERVER_NAME}%{REQUEST_URI} [END,NE,R=permanent]
</VirtualHost>

Graham Dumpleton
Sep 17, 2020, 2:06:08 AM9/17/20
to mod...@googlegroups.com
When you say "load test", do you mean totally overload the server way beyond the realistic amount of traffic you would ever expect to get? :-)
In other words, are you running tests like:
ab -c 15 -n 1000000000 http://mysite
or:
siege -c 15 -t 120s http://mysite
which is just throwing as many requests as absolutely possible at Apache?
This is only going to likely cause Apache to choke up as you are putting it into an overload state, made worse by number of server processes. It is the wrong way of evaluating how much load your server can realistically take.
What is the real number of requests/sec you would expect to ever receive?
Does every URL handler take 1 second to response, or are response times across the site varied?
What are the Apache MPM settings you have set? Since using prefork MPM, what do you have set for:
<IfModule mpm_prefork_module>
StartServers 1
MinSpareServers 1
MaxSpareServers 10
MaxRequestWorkers 250
MaxConnectionsPerChild 0
</IfModule>
Do you have:
WSGIRestrictEmbedded On
set in Apache configuration (outside of VirtualHost)?
And finally, do you have any performance monitoring in use, or at least have a backend metrics database/service where could report metrics?
Graham
On 17 Sep 2020, at 3:21 pm, Scott McConnell <scott.mc...@gmail.com> wrote:
Hello, I am using apache/mod_wsgi to serve a processor/ajax heavy Django application on an Ubuntu 16.04 machine. The app is working with low traffic on https (~1 sec response time), but I'm running into a bottleneck during load testing.During a load test (15 concurrent requestors) response time becomes ~6 sec, but CPU utilization peaks at 30% according to CloudWatch. I am using an EC2 instance and I've been continually increasing the size with no effect (now using c5.xlarge).The strange part is my htop output... one process is taking the majority of the CPU time, whereas the wsgi daemon processes don't seem to take on any tasks. This culprit process starts after I restart the server and never dies until the server is stopped.This was the output when I tried tracing the process:$ sudo strace -p 14645
strace: Process 14645 attached
restart_syscall(<... resuming interrupted restart_syscall ...>
Below are some htop screenshots, and I pasted my config at the bottom.When sorted by CPU utilization:
<Screen Shot 2020-09-17 at 12.37.42 AM.png>then all the way at the bottom are my daemon processes named wsws:
--
You received this message because you are subscribed to the Google Groups "modwsgi" group.
To unsubscribe from this group and stop receiving emails from it, send an email to modwsgi+u...@googlegroups.com.
To view this discussion on the web visit https://groups.google.com/d/msgid/modwsgi/3622efe1-62d3-4d07-99c9-74fac83541aen%40googlegroups.com.
<Screen Shot 2020-09-17 at 12.35.47 AM.png><Screen Shot 2020-09-17 at 12.37.42 AM.png>
Scott McConnell
Sep 17, 2020, 2:14:37 PM9/17/20
to modwsgi
My load test is pretty mellow, I thought...
$ sudo ls /etc/apache2/mods-enabled/
access_compat.load authn_file.load authz_user.load dir.conf mime.conf mpm_event.load proxy.conf rewrite.load socache_shmcb.load wsgi.conf
auth_basic.load authz_core.load deflate.conf dir.load mime.load negotiation.conf proxy.load setenvif.conf ssl.conf wsgi.load
authn_core.load authz_host.load deflate.load filter.load mpm_event.conf negotiation.load proxy_http.load setenvif.load ssl.load
$ apache2 -V
[Thu Sep 17 17:16:46.880034 2020] [core:warn] [pid 26387] AH00111: Config variable ${APACHE_RUN_DIR} is not defined
apache2: Syntax error on line 80 of /etc/apache2/apache2.conf: DefaultRuntimeDir must be a valid directory, absolute or relative to ServerRoot
Server version: Apache/2.4.29 (Ubuntu)
Server built: 2020-08-12T21:33:25
Server's Module Magic Number: 20120211:68
Server loaded: APR 1.6.3, APR-UTIL 1.6.1
Compiled using: APR 1.6.3, APR-UTIL 1.6.1
Architecture: 64-bit
Server MPM:
Server compiled with....
-D APR_HAS_SENDFILE
-D APR_HAS_MMAP
-D APR_HAVE_IPV6 (IPv4-mapped addresses enabled)
-D APR_USE_SYSVSEM_SERIALIZE
-D APR_USE_PTHREAD_SERIALIZE
-D SINGLE_LISTEN_UNSERIALIZED_ACCEPT
-D APR_HAS_OTHER_CHILD
-D AP_HAVE_RELIABLE_PIPED_LOGS
-D DYNAMIC_MODULE_LIMIT=256
-D HTTPD_ROOT="/etc/apache2"
-D SUEXEC_BIN="/usr/lib/apache2/suexec"
-D DEFAULT_PIDLOG="/var/run/apache2.pid"
-D DEFAULT_SCOREBOARD="logs/apache_runtime_status"
-D DEFAULT_ERRORLOG="logs/error_log"
-D AP_TYPES_CONFIG_FILE="mime.types"
-D SERVER_CONFIG_FILE="apache2.conf"
Originally was doing:
ab -c 15 -n 500 -s 10 https://mysite.com/
And this caused response times of ~8 sec
Trying again with:
ab -c 5 -n 500 -s 10 https://mysite.com/
still leads to ~3 sec response time. My hope was for this to be able to handle ~100 concurrent users, but I hadn't really thought about it in terms of requests/second...
I'm primarily worried about the base url handler, as the base url triggers a large get payload from an external API. Other url's have much faster response time.
I am just starting to get familiar with MPM's, and I'm still not entirely sure which MPM this server uses.
Because of this output:
access_compat.load authn_file.load authz_user.load dir.conf mime.conf mpm_event.load proxy.conf rewrite.load socache_shmcb.load wsgi.conf
auth_basic.load authz_core.load deflate.conf dir.load mime.load negotiation.conf proxy.load setenvif.conf ssl.conf wsgi.load
authn_core.load authz_host.load deflate.load filter.load mpm_event.conf negotiation.load proxy_http.load setenvif.load ssl.load
I believe I am using worker MPM. I was also confused by the blank "Server MPM:" line in this output:
$ apache2 -V
[Thu Sep 17 17:16:46.880034 2020] [core:warn] [pid 26387] AH00111: Config variable ${APACHE_RUN_DIR} is not defined
apache2: Syntax error on line 80 of /etc/apache2/apache2.conf: DefaultRuntimeDir must be a valid directory, absolute or relative to ServerRoot
Server version: Apache/2.4.29 (Ubuntu)
Server built: 2020-08-12T21:33:25
Server's Module Magic Number: 20120211:68
Server loaded: APR 1.6.3, APR-UTIL 1.6.1
Compiled using: APR 1.6.3, APR-UTIL 1.6.1
Architecture: 64-bit
Server MPM:
Server compiled with....
-D APR_HAS_SENDFILE
-D APR_HAS_MMAP
-D APR_HAVE_IPV6 (IPv4-mapped addresses enabled)
-D APR_USE_SYSVSEM_SERIALIZE
-D APR_USE_PTHREAD_SERIALIZE
-D SINGLE_LISTEN_UNSERIALIZED_ACCEPT
-D APR_HAS_OTHER_CHILD
-D AP_HAVE_RELIABLE_PIPED_LOGS
-D DYNAMIC_MODULE_LIMIT=256
-D HTTPD_ROOT="/etc/apache2"
-D SUEXEC_BIN="/usr/lib/apache2/suexec"
-D DEFAULT_PIDLOG="/var/run/apache2.pid"
-D DEFAULT_SCOREBOARD="logs/apache_runtime_status"
-D DEFAULT_ERRORLOG="logs/error_log"
-D AP_TYPES_CONFIG_FILE="mime.types"
-D SERVER_CONFIG_FILE="apache2.conf"
I did not have WSGIRestrictEmbedded On, but tried adding it-- no effect.
I do not have any performance monitoring or backend metrics. I've been going purely off of htop (and other similar tools) and CloudWatch. I also tried https://django-debug-toolbar.readthedocs.io/en/latest/ locally but it wasn't very insightful to my issue.
Scott McConnell
Sep 17, 2020, 2:16:48 PM9/17/20
to modwsgi
Oh, and I did not have any MPM settings set in Apache configuration. I tried adding what you sent and it didn't have an effect. Thanks so much for helping me out!
Graham Dumpleton
Sep 17, 2020, 8:04:04 PM9/17/20
to mod...@googlegroups.com
Based on what you have shown, I somewhat doubt you are using worker MPM, the fact that the process list shows a large number of Apache child worker processes would indicate that you are more likely using prefork MPM. That is, these processes.


If you are using worker MPM, then the MPM settings for that MPM would have to be bizarre to get that number of processes.
It actually worries me a bit that you claim you couldn't find any MPM settings. Usually Apache would have defaults in the config files. Usually they would only be missing if they had been explicitly removed
A much bigger problem is why the Apache child worker processes are showing a resident memory size of 869M. This suggests something is severely wrong with
your server setup as they should not be getting to be that large.
Only other thing can think of as to why seeing so many processes if using worker MPM is if for some reason htop is showing each thread as a separate entry. Linux used to do this decades ago, but these days only ever see tools like ps and top breaking out things as processes rather than threads. That wouldn't explain the process size though, which should not be that big unless something is setup wrong.
The mod_wsgi daemon process in contrast are only 13M.
How much changes have to made to standard out of the box Apache configuration? Have you wiped out all the Apache config and tried to construct your own from scratch? Can you explain the steps you did to update the Apache configuration?
I would also suggest you do these tests.
to confirm that your WSGI application requests are actually being handled by mod_wsgi in the daemon process group.
Graham
To view this discussion on the web visit https://groups.google.com/d/msgid/modwsgi/e43fccd6-091f-447d-a0e2-7c13051b52d9n%40googlegroups.com.
Graham Dumpleton
Sep 17, 2020, 9:33:01 PM9/17/20
to mod...@googlegroups.com
One question. Given you are using a quite old version of Apache, what version of mod_wsgi are you using?
If you are using a really old version of mod_wsgi, and are returning absolutely huge responses, the large child worker processes sizes could be because you are triggering some behaviour in Apache when proxying, which causes a blow out in memory. More recent versions of mod_wsgi have a workaround for triggering this issue in Apache. It likely will not help with response times, but should help with memory bloat if this is the cause.
In general you should avoid using the system package for mod_wsgi as they are often quite old and so missing out on improvements made since.
Graham
On 18 Sep 2020, at 10:03 am, Graham Dumpleton <graham.d...@gmail.com> wrote:
Based on what you have shown, I somewhat doubt you are using worker MPM, the fact that the process list shows a large number of Apache child worker processes would indicate that you are more likely using prefork MPM. That is, these processes.
<PastedGraphic-3.png>
If you are using worker MPM, then the MPM settings for that MPM would have to be bizarre to get that number of processes.It actually worries me a bit that you claim you couldn't find any MPM settings. Usually Apache would have defaults in the config files. Usually they would only be missing if they had been explicitly removed
A much bigger problem is why the Apache child worker processes are showing a resident memory size of 869M. This suggests something is severely wrong withyour server setup as they should not be getting to be that large.Only other thing can think of as to why seeing so many processes if using worker MPM is if for some reason htop is showing each thread as a separate entry. Linux used to do this decades ago, but these days only ever see tools like ps and top breaking out things as processes rather than threads. That wouldn't explain the process size though, which should not be that big unless something is setup wrong.The mod_wsgi daemon process in contrast are only 13M.
<PastedGraphic-4.png>
Scott McConnell
Sep 18, 2020, 12:01:33 AM9/18/20
to modwsgi
I am using mod_wsgi/4.5.17.
I haven't made any drastic changes to the server... I hadn't touched /etc/apache2/apache2.conf until talking to you. I haven't done much other than what's outlined here. I spun up a new instance the same way I did originally, and got the same `apache2 -V` result as I sent above (with the blank MPM).
Running the daemon vs. embedded showed that it is in fact running in daemon mode (a non-blank string was returned).
Running the second test showed that it's being run in the main interpreter (a blank string was returned).
I ran a load test on a different path of my site (one that is purely html), and these were the results (it happened wicked fast):
$ ab -c 15 -n 500 -s 10 https://mysite.com/blog/6/
Server Software: Apache/2.4.29
Server Hostname: mysite.com
Server Port: 443
SSL/TLS Protocol: TLSv1.2,ECDHE-RSA-CHACHA20-POLY1305,2048,256
TLS Server Name: mysite.com
Document Path: /blog/6/
Document Length: 13572 bytes
Concurrency Level: 15
Time taken for tests: 5.143 seconds
Complete requests: 500
Failed requests: 0
Total transferred: 6910500 bytes
HTML transferred: 6786000 bytes
Requests per second: 97.22 [#/sec] (mean)
Time per request: 154.296 [ms] (mean)
Time per request: 10.286 [ms] (mean, across all concurrent requests)
Transfer rate: 1312.13 [Kbytes/sec] received
Connection Times (ms)
min mean[+/-sd] median max
Connect: 2 2 1.4 2 12
Processing: 15 152 442.3 54 2772
Waiting: 14 137 434.2 44 2757
Total: 18 154 443.5 56 2784
Graham Dumpleton
Sep 18, 2020, 12:13:04 AM9/18/20
to mod...@googlegroups.com
That version of mod_wsgi is over 3 years old.There has been almost 20 releases since then. I checked back regarding the buffering workaround and it predates that version, and actually seems to only be absolutely necessary with Apache 2.2.
If you run a single request on the URL which is slow, how long does it take and how much data is it returning?
If you restart Apache, how much memory are the Apache child worker processes using before you send any requests?
With freshly started Apache, if you do single request against the slow URL, does one of the Apache child worker processes jump up in amount of memory it uses significantly? If yes, how much does it then consume and what did it start at?
Still trying to understand why the processes are using so much memory.
Graham
To view this discussion on the web visit https://groups.google.com/d/msgid/modwsgi/aa1d7a4f-f085-4e37-9218-81ddb91d4655n%40googlegroups.com.
Scott McConnell
Sep 18, 2020, 3:19:26 PM9/18/20
to mod...@googlegroups.com
If I run a single request on the slow URL, the response is ~2 sec. When a request is made on the slow URL, ~2.2 MB of data is fetched. That data is stored as a session variable and processed. Fetching the data from the external API is very fast-- it's just the processing of that data that takes time.
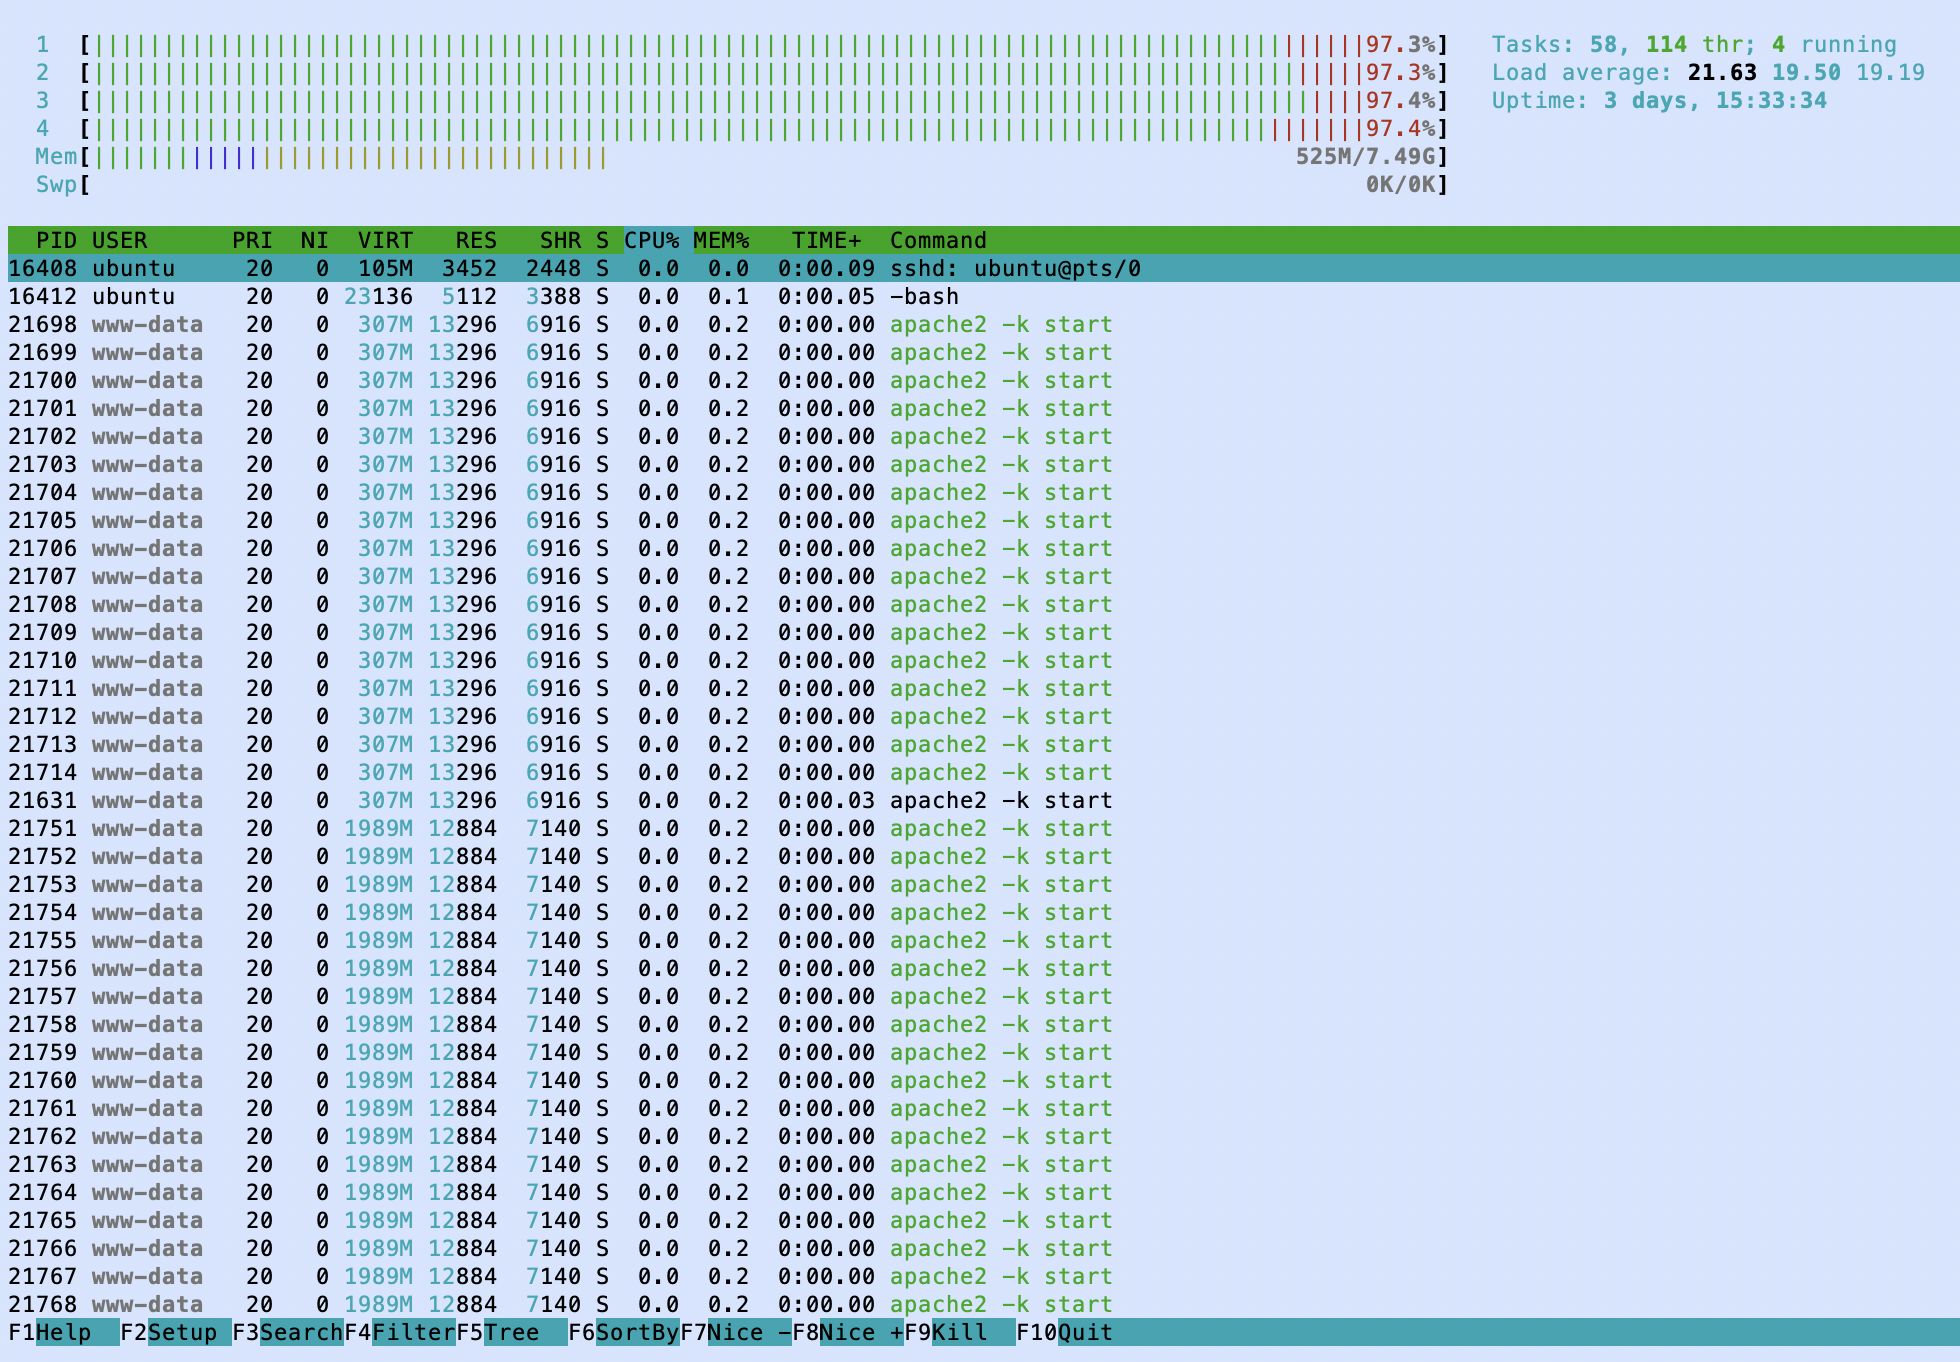
If I restart apache, this is what my Apache child worker processes look like:
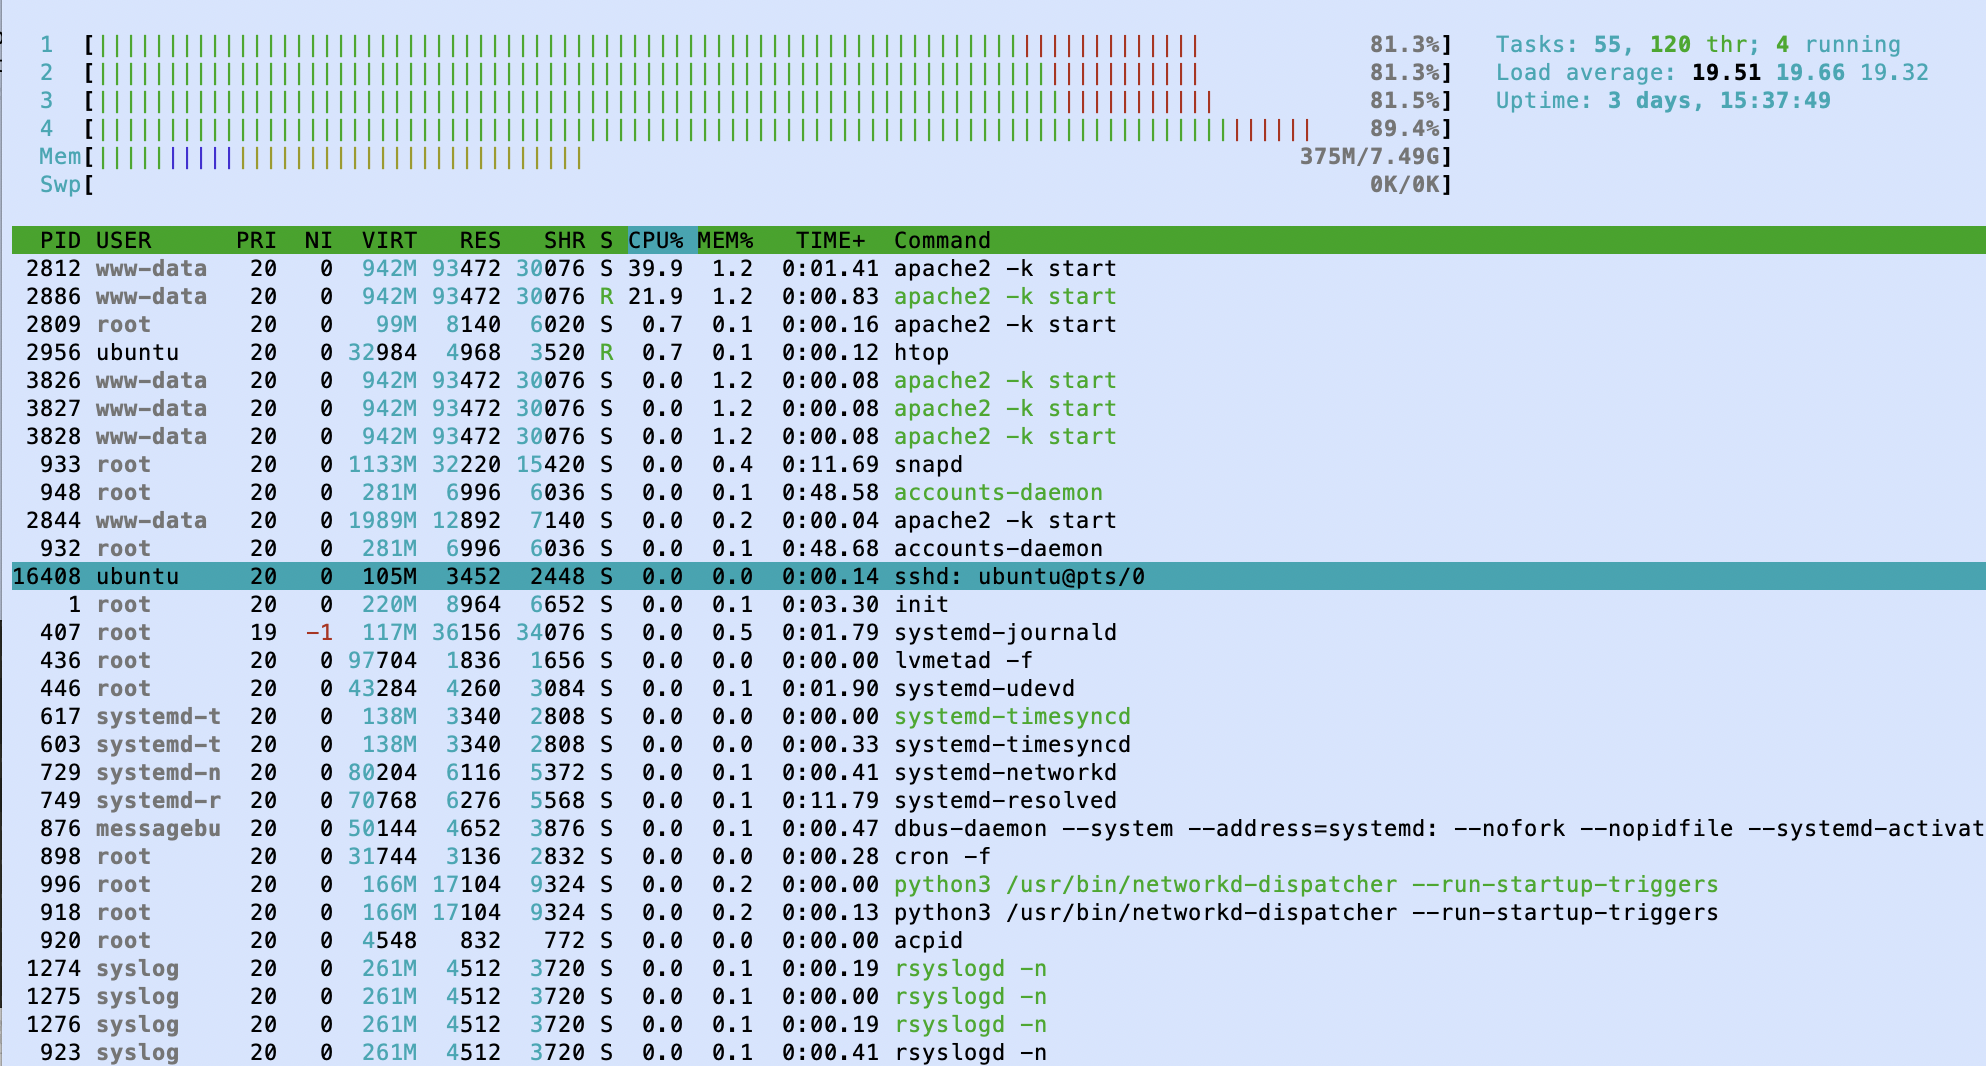
With a freshly start Apache, if I do a single request on the slow URL:
You received this message because you are subscribed to a topic in the Google Groups "modwsgi" group.
To unsubscribe from this topic, visit https://groups.google.com/d/topic/modwsgi/Er3ApBv0lgQ/unsubscribe.
To unsubscribe from this group and all its topics, send an email to modwsgi+u...@googlegroups.com.
To view this discussion on the web visit https://groups.google.com/d/msgid/modwsgi/299A2E1B-5CF5-410C-A4D5-55077AEECD5F%40gmail.com.
Scott McConnell
Duke University '20
Electrical and Computer Engineering | Computer Science
Graham Dumpleton
Sep 18, 2020, 5:35:07 PM9/18/20
to mod...@googlegroups.com
On 19 Sep 2020, at 5:19 am, Scott McConnell <scott.mc...@gmail.com> wrote:If I run a single request on the slow URL, the response is ~2 sec. When a request is made on the slow URL, ~2.2 MB of data is fetched.
So that 2.2MB is fetched by the WSGI application from some backend database?
What is the size of the final response returned to the web browser?
Either way, it sounds like you re doing heavy duty CPU bound processing in the WSGI application. Yes? How much memory does that processing require?
The problem with this is since htop should show the WSGI daemon process name, the output from htop suggests that a lot of CPU processing is being done in the Apache child worker processes instead. Still doesn't make sense why memory for those processes is also so high. Can you perhaps show the htop tree view just to make sure that these aren't actually sub processes of the Apache processes. In other words, how is the processing done, in process, or by fork/exec some other code/executable?

Usually one would want to avoid heavy duty processing inside of the WSGI application processes. Instead what one would usually do in this sort of situation is use something Celery, and have a backend job processing system. Thus the WSGI application sends a request to Celery to create a job to process the data, and all the WSGI application gets back is the processes result. Where the processing takes a long time, the WSGI application may even return immediately the job is queued, and rely on polling to determine when the job is completed and get the final result. This avoids tying up request handler threads.
In this model where heavy CPU work is done in Celery, you can switch the WSGI application to use multithreaded and cut down on the number of web application processes, dropping memory usage a lot, since those processes will then be principally I/O bound and not CPU bound.
So you may be better off changing the architecture of your application.
That data is stored as a session variable and processed. Fetching the data from the external API is very fast-- it's just the processing of that data that takes time.If I restart apache, this is what my Apache child worker processes look like:
<image.png>With a freshly start Apache, if I do a single request on the slow URL:
<image.png>
To view this discussion on the web visit https://groups.google.com/d/msgid/modwsgi/CAMD48d1rQNUf-Ga5YqVHWLSfEs9Oa-ySY8T8gwH_%2BBm1FDrNog%40mail.gmail.com.
Reply all
Reply to author
Forward
0 new messages