Negative variance error in CFA model (with addressing measurement error/repeatability))

Magali Frauendorf
Hi,
Similar to this approach described by James Grace (https://prd-wret.s3-us-west-2.amazonaws.com/assets/palladium/production/s3fs-public/atoms/files/SEM_09_1_Modeling_with_latent_variables.pdf), I want to address measurement errors in my model.
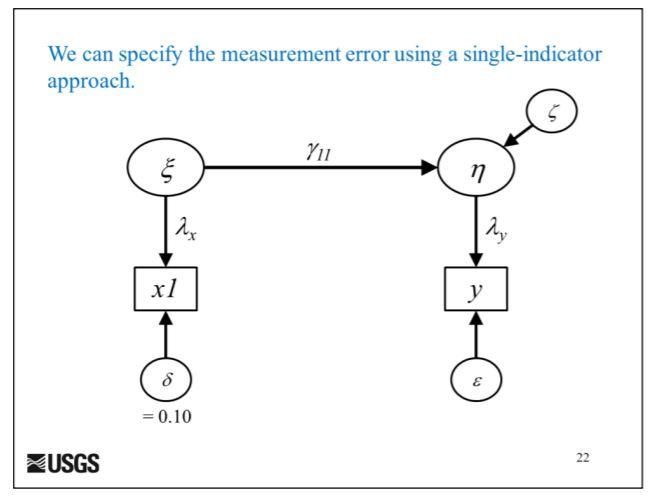
However, my “eta” is a latent variable described by 3 indicators instead of 1 (in this example). I want to model the following:
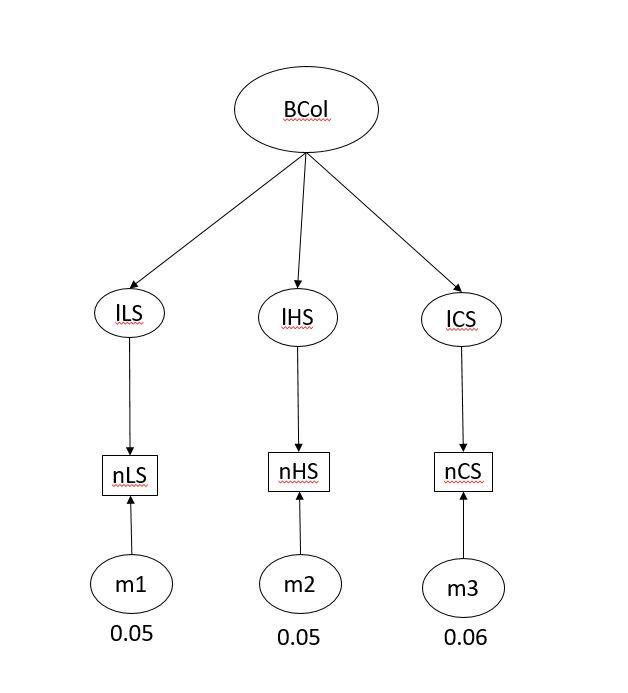
BCol (bill colour of an individual), being the latent variable defined by nLS, nHS and nCS (measured and standardized lightness, hue and chroma (saturation); the three axes/parameters that define a colour). The variables themselves are correlated:
nCS & nLS =0.44
nCS & nHS = -0.74
nHS & nLS =0.92
m1, m2 and m3 are the measurement errors on the observed variables (calculated with ICC package; repeatability of measurements). Because I want to address the measurement error I added the latent variables lLS, lHS and lCS between the latent BCol and the measured variables.
My syntax is the following:
lLS=~nLS
lHS=~nHS
lCS=~nCS
BCol=~lLS+lHS+lCS
nLS ~~ 0.05* nLS
nHS~~0.05*nHS
nCS~~0.06*nCS
My output looks like this:
lavaan 0.6-5 ended normally after 58 iterations
Estimator ML
Optimization method NLMINB
Number of free parameters 9
Number of observations 598
Model Test User Model:
Test statistic 0.000
Degrees of freedom 0
Parameter Estimates:
Information Expected
Information saturated (h1) model Structured
Standard errors Standard
Latent Variables:
Estimate Std.Err z-value P(>|z|) Std.lv Std.all
lLS =~
nLS 1.000 0.974 0.975
lHS =~
nHS 1.000 0.974 0.975
lCS =~
nCS 1.000 0.969 0.969
BCol =~
lLS 1.000 0.758 0.758
lHS 1.680 0.080 21.076 0.000 1.273 1.273
lCS -0.810 0.043 -18.724 0.000 -0.617 -0.617
Intercepts:
Estimate Std.Err z-value P(>|z|) Std.lv Std.all
.nLS -0.000 0.041 -0.000 1.000 -0.000 -0.000
.nHS -0.000 0.041 -0.000 1.000 -0.000 -0.000
.nCS 0.000 0.041 0.000 1.000 0.000 0.000
.lLS 0.000 0.000 0.000
.lHS 0.000 0.000 0.000
.lCS 0.000 0.000 0.000
BCol 0.000 0.000 0.000
Variances:
Estimate Std.Err z-value P(>|z|) Std.lv Std.all
.nLS 0.050 0.050 0.050
.nHS 0.050 0.050 0.050
.nCS 0.060 0.060 0.060
.lLS 0.404 0.031 12.943 0.000 0.426 0.426
.lHS -0.589 0.057 -10.359 0.000 -0.621 -0.621
.lCS 0.581 0.039 15.020 0.000 0.619 0.619
BCol 0.545 0.054 10.066 0.000 1.000 1.000
R-Square:
Estimate
nLS 0.950
nHS 0.950
nCS 0.940
lLS 0.574
lHS NA
lCS 0.381
I understand that the warning comes from the negative residual covariance in lHS (-0.589) and also results in the standardized estimate being larger than 1 and an NA in the R-square. But what can be the reason for it and what can I do about it. I understand that misspecification of the model can be a reason. The sample size seems ok to me for such a simple model. Can the reason lie in weakness covariance among the indicators? I does not look to me like this because nHS is quite strongly related to the other two variables.
I know that I could fix the variance to zero, but I think that is not what I am interested in when I want to address measurement errors. Maybe I did not specify the model correctly?
The covariance matrix of the latent variables look like this:
lLS lHS lCS BCol
lLS 0.948
lHS 0.915 0.948
lCS -0.441 -0.741 0.938
BCol 0.545 0.915 -0.441 0.545
I also have doubts because the model fit seems perfect:
gfi agfi cfi rni srmr rmsea 1 1 1 1 0 0
Thanks in advance for your help!

Edward Rigdon
--
You received this message because you are subscribed to the Google Groups "lavaan" group.
To unsubscribe from this group and stop receiving emails from it, send an email to lavaan+un...@googlegroups.com.
To view this discussion on the web visit https://groups.google.com/d/msgid/lavaan/ef680483-e546-43cb-9b53-a2a2c8bdcc47o%40googlegroups.com.
Magali Frauendorf
Hi Edward,
Thanks a lot for your answer!
I thought that a latent variable would be appropriate to use as “Bill colour” since two out of the three correlations were pretty high (0.74 and 0.92). If the variables are highly correlated I would expect them being arranged on one dimension. When I run a PCA on the same data I get a PC1 of 80%, which I think is quiet high. But it is true that the third correlation is much lower (0.44) and that could indicate that a composite variable might be more useful?! Would you say that the correlation between the variables can help to give you an idea if a latent variable or composite variable is more appropriate to use in a specific case? Of course next to looking at the theoretical background and hypothesis.
I understand from literature that a composite variable always needs a response variable in order to be able to sum the collective effect of all observed variables. Is that correct? So I could use “individual survival” for instance as a response variable?
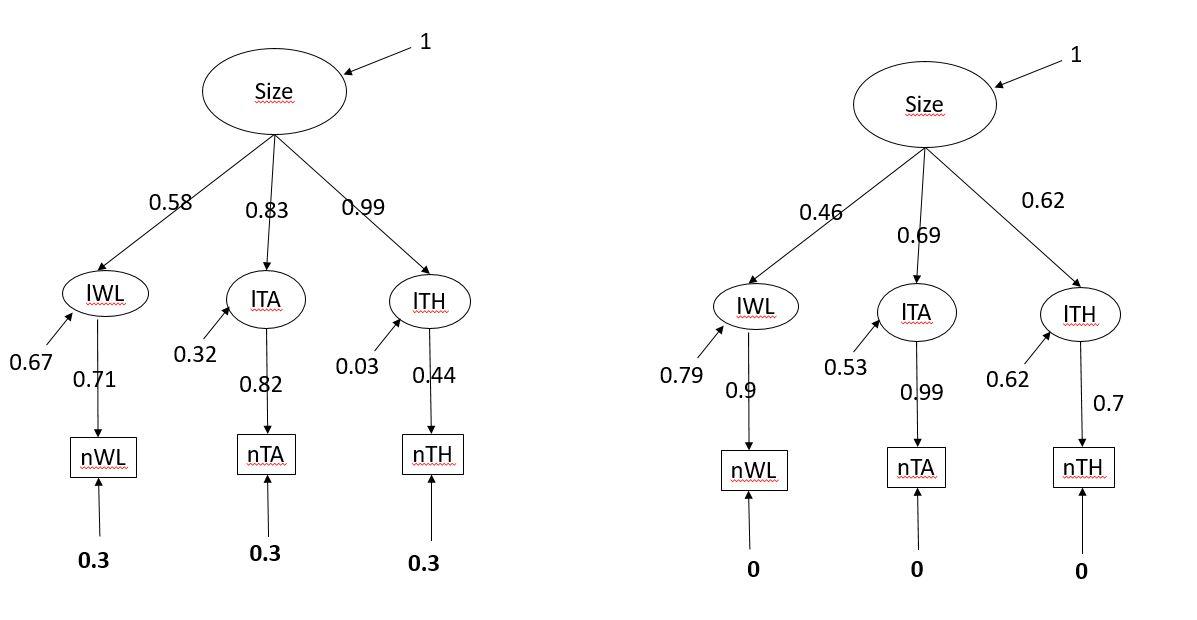
Concerning your first point: I run it again with a different dataset where the model run smoothly (no warnings and good model fit). The latent variable is body size and I added three latents between the observed variable and the latent variable body size to address measurement errors (that are specified/fixed in the model; bold numbers). I run it with once measurement error (variance) fixed at 0.3 for each observed variable and once fixed at 0 (no error) for each observed variable. Even though the path coefficients changes and it is possible to disentangle the effect of the measurement error from the remaining unexplained variation, the latent variable bill size does not change at all in both example.
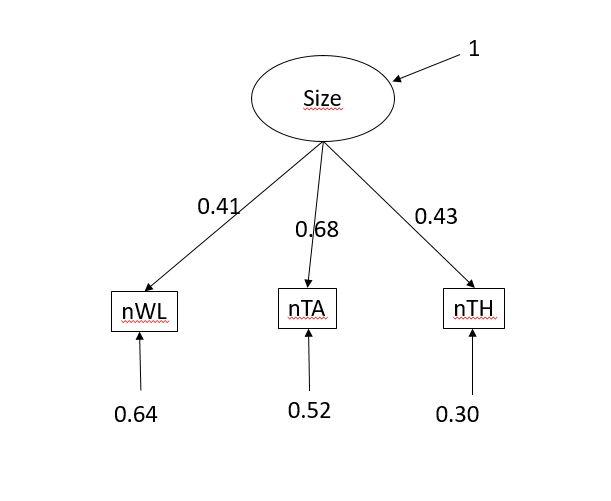
The easier approach that you suggested, by removing the latent variables (lWL, lTA and lTH) resulted also in exactly the same values for the latent variable. In that model the variance is estimated by the model and not fixed as in the other two examples.
So can I conclude from this that addressing measurement errors is
possible and makes sense in regression analysis (path analysis) but not in a
CFA (models with latent constructs)? Or would it make sense if I add a response
variable (e.g. survival ~ latent body size)?
Thanks!
Magali
Edward Rigdon
--
You received this message because you are subscribed to the Google Groups "lavaan" group.
To unsubscribe from this group and stop receiving emails from it, send an email to lavaan+un...@googlegroups.com.
To view this discussion on the web visit https://groups.google.com/d/msgid/lavaan/225532ef-9c87-4e0d-93fa-c16f95ba47abo%40googlegroups.com.