growth curve model - problems with standardised coefficients

167 views
Skip to first unread message

AV AV

unread,
Jun 24, 2019, 12:43:58 PM6/24/19
to lavaan

Hi everyone,


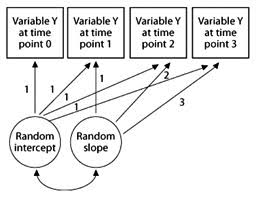
I have recently started using lavaan to compute growth curve models with an intercept and a linear slope, for my three time points continuous variable, with a continous time-invariant covariate (COV).

The model has good fit parameters, but I get standardised values between intercept and c=variables higher than 1 - which is obviously impossible.


There is no error message, but something must have gone wrong, or at least needs changing.


Does anyone has any idea what?


Here is my model:


'

# latent variable definitions

#intercept

eta_1 =~ 1*VAR_TIME1

eta_1 =~ 1*VAR_TIME2

eta_1 =~ 1*VAR_TIME3


#linear slope

eta_2 =~ 0*VAR_TIME1

eta_2 =~ 1*VAR_TIME2

eta_2 =~ 2*VAR_TIME3


# factor variances

eta_1 ~~ eta_1

eta_2 ~~ eta_2


# covariances among factors 

eta_1 ~~ eta_2


# factor means 

eta_1 ~ start(4)*1

eta_2 ~ start(2)*1


# manifest variances

VAR_TIME1~~ theta* VAR_TIME1

VAR_TIME2~~ theta* VAR_TIME2

VAR_TIME3~~ theta* VAR_TIME3


# manifest means

VAR_TIME1~ 0*1

VAR_TIME2~ 0*1

VAR_TIME3~ 0*1


# modification#

VAR_TIME2~ VAR_TIME1

VAR_TIME3~ VAR_TIME2


#regression of time-invariant covariate on intercept and slope factors

eta_1~COV

eta_2~ COV


#variance of covariate

COV ~~ COV


#means of covariate 

COV ~ 1

'


And the problematic result:


Latent Variables:

                   Estimate  Std.Err  z-value  P(>|z|)   Std.lv  Std.all

  eta_1 =~                                                              

    VAR_TIME1        1.000                               5.990    0.965

    VAR_TIME2        1.000                               5.990    1.155

    VAR_TIME3        1.000                               5.990    1.169

  eta_2 =~                                                             

    VAR_TIME1        0.000                               0.000    0.000

    VAR_TIME2        1.000                               1.593    0.307

    VAR_TIME3        2.000                               3.185    0.622


Terrence Jorgensen

unread,
Jun 25, 2019, 1:35:55 AM6/25/19
to lavaan

which is obviously impossible.


No, it's not.  Not sure why you are interested in "standarized" values of a design matrix, but each indicator loads onto multiple growth factors, so those are standardized partial slopes, which can exceed 1.

Standardization is tricky to justify in growth models (e.g., it assumes your indicators are different variables, not the same variable measured repeatedly), make sure you know what you want to interpret. 


Terrence D. Jorgensen
Assistant Professor, Methods and Statistics
Research Institute for Child Development and Education, the University of Amsterdam

Andy Supple

unread,
Jun 25, 2019, 10:36:07 AM6/25/19
to lav...@googlegroups.com
Aren't the "problematic" parameters just your time loadings? You're telling the program to scale time according to those factor loadings which you provide, so there isn't any reason to evaluate them, thus the std coefficients have no relevance.

--
You received this message because you are subscribed to the Google Groups "lavaan" group.
To unsubscribe from this group and stop receiving emails from it, send an email to lavaan+un...@googlegroups.com.
To post to this group, send email to lav...@googlegroups.com.
Visit this group at https://groups.google.com/group/lavaan.
To view this discussion on the web visit https://groups.google.com/d/msgid/lavaan/1a1c43fd-82be-4993-9c0d-7b681fbc7dfa%40googlegroups.com.
For more options, visit https://groups.google.com/d/optout.


--

AV AV

unread,
Jun 25, 2019, 11:10:18 AM6/25/19
to lavaan
Thank you both for your replies!

I agree that the loadings are not the most interesting part of the model, but I am going to report the model as a graph, hence they will appear in the final report.
In any case, as is the case for CFA, for example, I always considered standardised loadings higher than 1 a sign that there might be some problems or misspecifications - I've never seen a growth curve graph with loadings higher than 1 in a research article in my field.
Maybe I'm wrong, as I've read that there might be cases where standardised loadings higher than 1, but I think this would need a lot of justifications.

One author notes: "Standardized values over 1.0 can sometimes be valid (Jöreskog, 1999), but may also indicate there is a correlation very near 1.0, unreasonable model constraints have been imposed, or there are other problems with the model."

Now, my variable at Time 1, 2 and 3 are heavily correlated (after all it's the same participants tested on the same test) but still lower than .80.

I tried constraining the unstandardised loading to be equal, rather than 1, and the variance of the Intercept factor at 1 (as suggested by: https://www.youtube.com/watch?v=Vx24KFf-rAo&list=LLRnqP9oW8HH75hhsSITnFyg&index=2&t=2s for CFA with AMOS), but the model becomes much much worse.

Are there any other constrains I could try?

I might consider person-centering standardisation, but I would rather keep the variable as it is, which is the usual approach in growth curve modeling, as far as my knowledge goes (as I said I am just starting using this approach, and I am self-teaching, so this is what my textbooks suggest).

Thank you both again!


To unsubscribe from this group and stop receiving emails from it, send an email to lav...@googlegroups.com.

To post to this group, send email to lav...@googlegroups.com.
Visit this group at https://groups.google.com/group/lavaan.
To view this discussion on the web visit https://groups.google.com/d/msgid/lavaan/1a1c43fd-82be-4993-9c0d-7b681fbc7dfa%40googlegroups.com.
For more options, visit https://groups.google.com/d/optout.

Andy Supple

unread,
Jun 25, 2019, 11:18:56 AM6/25/19
to lav...@googlegroups.com
I think you're confusing a regular CFA model with a growth curve model. In the growth curve you are setting the factor loadings to specific values to scale time. Thus they aren't parameters estimated by the model. If you want those in the graph or figure you present, what readers are expecting are how you scaled time which is loadings of 1 for the intercept factor and then 0, 2, 3, for the slope factor. Those aren't estimates and so the std values have no meaning. 

In a regular CFA like in the video those are estimated parameters that sometimes could be >1 in the standardized solution and, yes, while possible, should be scrutinized for overlapping items. 

In your case, however, I don't think you have an issue. Your figure would show 1's on all the loadings for the intercept factor, then the time scaling (0,1,2,3 or whatever) on the slope factor. 

image.png


To unsubscribe from this group and stop receiving emails from it, send an email to lavaan+un...@googlegroups.com.

To post to this group, send email to lav...@googlegroups.com.
Visit this group at https://groups.google.com/group/lavaan.

For more options, visit https://groups.google.com/d/optout.

AV AV

unread,
Jun 26, 2019, 11:52:46 AM6/26/19
to lavaan
Thank you very much for your help!
It makes more sense to me now, and it's true, I was probably mixing up the interpretation of the parameters in CFA and mediation models with those of a growth model, as I am more familiar with those!

In fact, my final goal was initially to run a random intercept cross-lagged panel model with two different time varying variables, but I went back to explore each individually first with a growth curve now, hence the confusion!

Thank you again, I think I am more confident in these results now!

Reply all
Reply to author
Forward
0 new messages