Jenkins Kubernetes plugin - scheduling hangs when there are more than 1000 builds in queue
27 views
Skip to first unread message

Andrey Babushkin
Jun 5, 2020, 2:24:17 PM6/5/20
to Jenkins Users
Greetings Jenkins community!
My team uses Jenkins to run long validation cycles. We use Kubernetes plugin (we run our own bare-metal cluster) and many quick single test case builds.
Recently our number of test cases have grown drastically and we've noticed that scheduling of new builds is very slow despite we have enough compute resources in cluster.
To summarize the problem:
- Jenkins has over 1000 builds in queue
- They weren't started at the same time - number of builds grows from zero to 1000 within 14 hours. We've added this delay to, well, prevent Jenkins from hanging :)
- Those builds schedule very slowly (so queue size decreases not as fast as we desire)
- There are enough resources in Kubernetes cluster - therefore slowness isn't caused by long waiting time. Other Jenkins instances we have can schedule builds quickly into the same Kubernetes (so Kubernetes is fine)
- UI is responsive, but actions like configSubmit on jobs or nodes are slow
This server runs only validation cycles, no builds are executed directly on master. We use Jenkins from official Docker image 2.222.3-jdk11 with Kubernetes plugin version 1.24.
Hardware-wise we have server with two Intel(R) Xeon(R) CPU E5-2670 2.60GHz (8 cores each with hyper-threading enabled - 32 vCPU in total) and 128GB of RAM.
Jenkins container uses --network=host option, inbound (JNLP) agents provisioned by Kubernetes plugin use random port.
Settings of Kubernetes cloud we use:
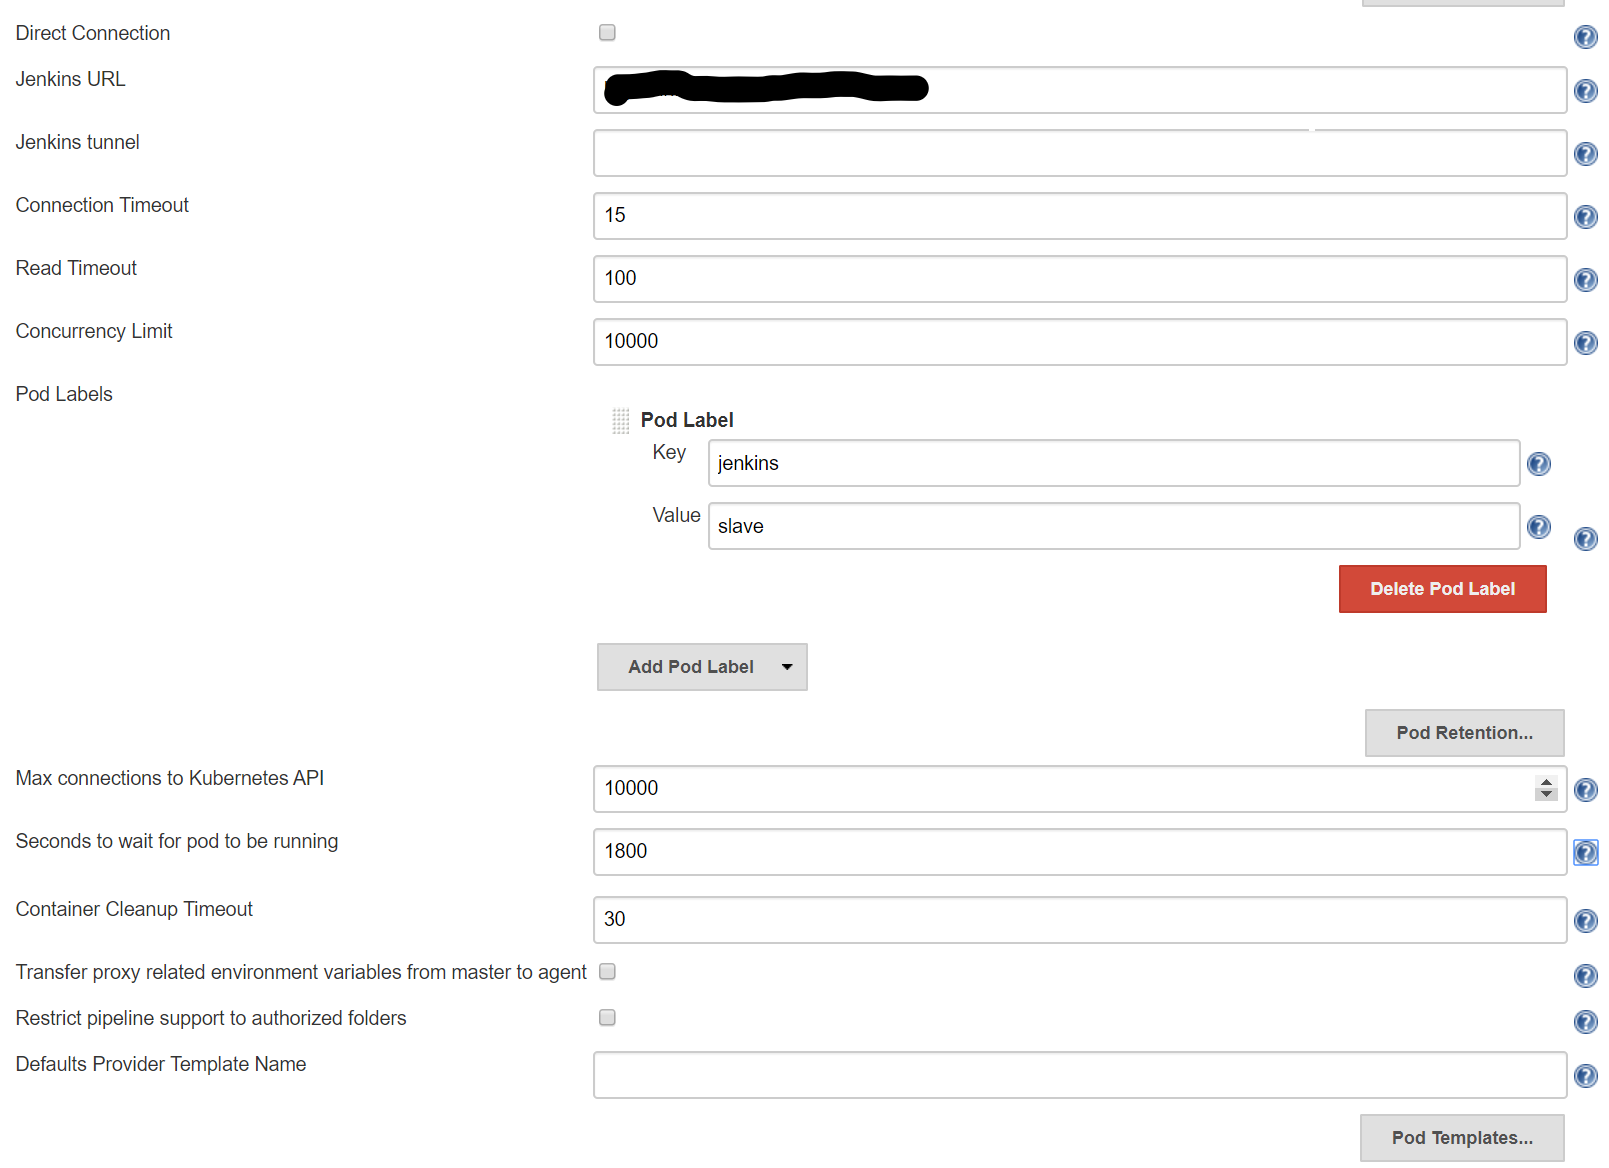
We've increased Max connections to Kubernetes API when the problem appeared (we thought we may have been bounded by number of connections).
I've attached plugins.txt file also and here are JVM options we use:
JAVA_OPTS=-Xms64G -Xmx64G -XX:+HeapDumpOnOutOfMemoryError -Dorg.jenkinsci.plugins.durabletask.BourneShellScript.HEARTBEAT_CHECK_INTERVAL=84000 -Dpermissive-script-security.enabled=no_security # don't do this in production -Dorg.apache.commons.jelly.tags.fmt.timeZone=Europe/Moscow -Dhudson.model.DirectoryBrowserSupport.CSP= -Dfile.encoding=UTF-8 -Djenkins.displayurl.provider=org.jenkinsci.plugins.displayurlapi.ClassicDisplayURLProvider -Xlog:gc*,gc+ref=debug,gc+heap=debug,gc+age=trace:file=/var/jenkins_home/gc-%p-%t.log:tags,uptime,time,level:filecount=10,filesize=500m -XX:-UseCompressedOops -Dcom.sun.management.jmxremote -Dcom.sun.management.jmxremote.port=9090 -Dcom.sun.management.jmxremote.rmi.port=9090 -Dcom.sun.management.jmxremote.local.only=false -Dcom.sun.management.jmxremote.authenticate=false -Dcom.sun.management.jmxremote.ssl=falseAs you can see we've tried to profile Jenkins with VisualVM. I have thread dump and snapshot, but I don't want to share them publicly. I can send it to you personally, if you want to take a look.
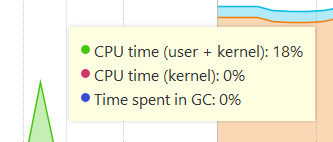
CPU was completely fine, around 20% and GC takes as little as 0.1%
At this moment my team and me are out of guesses, so I'd appreciate any advice you have

Liejun Tao
Jun 6, 2020, 8:47:40 PM6/6/20
to jenkins...@googlegroups.com
Have you tried this?
-Dhudson.slaves.NodeProvisioner.initialDelay=0 \
-Dhudson.slaves.NodeProvisioner.MARGIN=50 \
-Dhudson.slaves.NodeProvisioner.MARGIN0=0.85 \
-Dhudson.slaves.NodeProvisioner.MARGIN=50 \
-Dhudson.slaves.NodeProvisioner.MARGIN0=0.85 \
In the jenkins.log, is there anything interesting when you expect an agent get provisioned but it didn't?
IMHO I would think the "concurrent limit" is way too high.
How about start with 100 then tune it high?
--
You received this message because you are subscribed to the Google Groups "Jenkins Users" group.
To unsubscribe from this group and stop receiving emails from it, send an email to jenkinsci-use...@googlegroups.com.
To view this discussion on the web visit https://groups.google.com/d/msgid/jenkinsci-users/7ea695e9-889f-486a-91b9-974a68e0f3d9o%40googlegroups.com.
Thanks,
Baibai

Vincent Latombe
Jun 8, 2020, 4:34:17 AM6/8/20
to Jenkins Users
Set up a logger on package org.csanchez.jenkins.plugins.kubernetes to get more details about the provisioning.
The NodeProvisioning system properties suggested above are not necessary (the plugin has its own implementation of NodeProvisioner.Strategy which bypasses the built-in clock)
Vincent
To view this discussion on the web visit https://groups.google.com/d/msgid/jenkinsci-users/CAMRm5jbShWub2JUJbAT8Fc4JYxGUiY2ySQVCiYuLeSS8%2BWMZgA%40mail.gmail.com.
Reply all
Reply to author
Forward
0 new messages