| On one the new pipelines, I just experienced a problem. With each build, the various issues (PMD, Open Tasks, CPD & Styles) get recorded and up until build #79 (currently at #108), it also updated the "Aggregated Analysis Results" graph.
But out ot nowhere it doesn't get updated now.
I didn't change the Jenkinsfile all day, also didn't change any server side configuration. Not even restarted Jenkins or something.

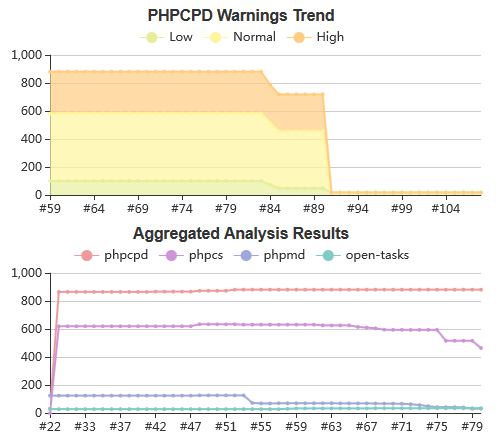
Here, you see the PHPCPD graph going up to #107 but the "Aggregated Analysis Results" only go up to #79.
I checked the logs of build 78 up to 81 but haven't found any clue in there.
I tried to locate the related file(s) for the aggregated graph on disk, but didn't find any.
I just created a new branch and it still works there: 
Part of our Jenkinsfile:
[...]
always {
	[...]
	recordIssues([
		healthy: 25,
		unhealthy: 100,
		sourceCodeEncoding: 'UTF-8',
		tools: [
			pmdParser(
				id: 'phpmd',
				name: 'PHPMD',
				pattern: 'build/logs/pmd.xml',
				reportEncoding: 'UTF-8'
			)
		]
	])
	recordIssues([
		healthy: 1,
		unhealthy: 50,
		sourceCodeEncoding: 'UTF-8',
		tools: [
			checkStyle(
				id: 'phpcs',
				name: 'PHPCS',
				pattern: 'build/logs/checkstyle.xml',
				reportEncoding: 'UTF-8'
			)
		]
	])
	recordIssues([
		healthy: 5,
		unhealthy: 250,
		sourceCodeEncoding: 'UTF-8',
		tools: [
			taskScanner(
				normalTags: 'TODO,@todo',
				highTags: 'FIXME,@fixme',
				ignoreCase: true,
				includePattern: 'bin/**/*.php,config/**/*.php,src/**/*.php,src/**/*.ctp,plugins/**/*.php,plugins/**/*.ctp,resources/**/*.php,tests/**/*.php,tests/**/*.ctp'
			)
		]
	])
	recordIssues([
		healthy: 5,
		unhealthy: 100,
		sourceCodeEncoding: 'UTF-8',
		tools: [
			cpd(
				id: 'phpcpd',
				name: 'PHPCPD',
				highThreshold: 100,
				normalThreshold: 50,
				pattern: 'build/logs/pmd-cpd.xml',
				reportEncoding: 'UTF-8'
			)
		]
	])
}
[...]
This was reported first on Gitter. https://gitter.im/jenkinsci/warnings-plugin?at=5d41f24b4ba6af0b02661dd9 You can write me on Gitter, if you want. |