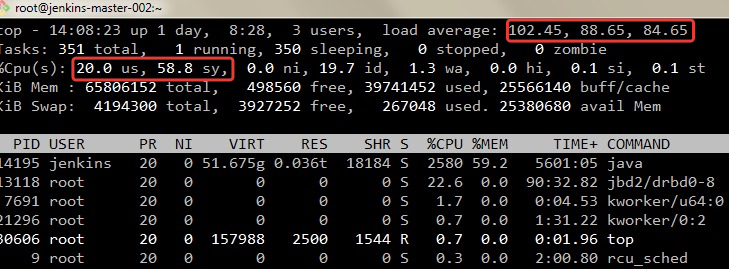
| We have several heavily loaded instances of Jenkins. The most biggest of them builds around 30 000 jobs per day (two others - around 6000). After upgrade to Jenkins 2.107.3 on the most heavily loaded instance we see a hight CPU sys time consumption.  After some investigation we have found that the processes, who consume CPU sys time most of all, are hanging on "futext" system call:
% time     seconds  usecs/call     calls    errors syscall
------ ----------- ----------- --------- --------- ----------------
 74.31 13168.872885       68562    192072     38348 futex
 19.97 3539.132374     5998529       590       440 restart_syscall
  1.98  351.174121       24197     14513        18 recvfrom
  1.75  310.265366         865    358527      1466 write
  1.05  185.451445       59325      3126           poll
  0.18   31.986477        1823     17547      1006 read
  0.15   26.976110       33100       815           accept
  0.11   19.407311         982     19760      2760 stat
In strace output for such processes we can see something like that:
 futex(0x7fc42800ba54, FUTEX_WAIT_BITSET_PRIVATE, 1, {5161981, 228340395}, ffffffff) = -1 ETIMEDOUT (Connection timed out)
futex(0x7fc42800ba28, FUTEX_WAKE_PRIVATE, 1) = 0
futex(0x7fc42800ba54, FUTEX_WAIT_BITSET_PRIVATE, 1, {5161981, 278655215}, ffffffff) = -1 ETIMEDOUT (Connection timed out)
futex(0x7fc42800ba28, FUTEX_WAKE_PRIVATE, 1) = 0
futex(0x7fc42800ba54, FUTEX_WAIT_BITSET_PRIVATE, 1, {5161981, 328848067}, ffffffff) = -1 ETIMEDOUT (Connection timed out)
futex(0x7fc42800ba28, FUTEX_WAKE_PRIVATE, 1) = 0
futex(0x7fc42800ba54, FUTEX_WAIT_BITSET_PRIVATE, 1, {5161981, 379185329}, ffffffff) = -1 ETIMEDOUT (Connection timed out)
corresponding Java-process:
"MVStore background writer nio:/u01/jenkins/jenkins_home/jenkins-jobs/jenkins-jobs.mv.db" #96324 daemon prio=5 os_prio=0 tid=0x00007fc3500a4000 nid=0x6048 in Object.wait() [0x
   java.lang.Thread.State: TIMED_WAITING (on object monitor)
<------>at java.lang.Object.wait(Native Method)
<------>at org.h2.mvstore.MVStore$BackgroundWriterThread.run(MVStore.java:2715)
<------>- locked <0x00000001d78dfc88> (a java.lang.Object)

   Locked ownable synchronizers:
<------>- None
Environment: RHEL 7.5 with the latest updates (except of kernel). DRBD+ext4. OpenStack KVM. 32 CPU 64 GB RAM.
JENKINS_JAVA_OPTIONS="-Djava.awt.headless=true -Dgroovy.use.classvalue=true -Xms32g -Xmx32g -XX:MaxGCPauseMillis=200 -XX:ParallelGCThreads=20 -XX:ConcGCThreads=5 -XX:InitiatingHeapOccupancyPercent=75 -XX:MaxMetaspaceSize=3024m -XX:+HeapDumpOnOutOfMemoryError -XX:HeapDumpPath=/u01/jenkins -XX:+UnlockDiagnosticVMOptions -Djenkins.model.Jenkins.logStartupPerformance=true -Dhudson.plugins.git.GitStatus.allowNotifyCommitParameters=true -Dhudson.model.ParametersAction.keepUndefinedParameters=true -Dhudson.model.DirectoryBrowserSupport.CSP=\"default-src 'self'; img-src 'self'; script-src 'self' 'unsafe-inline' 'unsafe-eval'; style-src 'self' 'unsafe-inline'; child-src 'self'; frame-src 'self';\" -Djenkins.model.DirectoryBrowserSupport.CSP=\"default-src 'self'; img-src 'self'; script-src 'self' 'unsafe-inline' 'unsafe-eval'; style-src 'self' 'unsafe-inline'; child-src 'self'; frame-src 'self';\" -Dorg.apache.commons.jelly.tags.fmt.timeZone=\"Europe/Moscow\" -Dhudson.model.User.SECURITY_243_FULL_DEFENSE=false -Dcom.cloudbees.workflow.rest.external.ChangeSetExt.resolveCommitAuthors=false -server -XX:+UseG1GC -XX:+ExplicitGCInvokesConcurrent -XX:+ParallelRefProcEnabled -XX:+UseStringDeduplication -Xloggc:${JENKINS_HOME}/gc_logs/gc-%t.log -XX:NumberOfGCLogFiles=5 -XX:+UseGCLogFileRotation -XX:GCLogFileSize=20m -XX:+PrintGC -XX:+PrintGCDateStamps -XX:+PrintGCDetails -XX:+PrintTenuringDistribution -XX:+PrintAdaptiveSizePolicy -Dcom.sun.management.jmxremote.port=3333 -Dcom.sun.management.jmxremote.authenticate=false -Dcom.sun.management.jmxremote.ssl=false -Djava.io.tmpdir=/u01/jenkins/tmp -Dhudson.remoting.ClassFilter=org.jenkinsci.lib.xtrigger.AbstractTrigger"
root@jenkins-master-002:~$  uname -a
Linux jenkins-master-002.vm.mos.cloud.sbrf.ru 3.10.0-514.el7.x86_64 #1 SMP Wed Oct 19 11:24:13 EDT 2016 x86_64 x86_64 x86_64 GNU/Linux

root@jenkins-master-002:~$  java -version
java version "1.8.0_151"
Java(TM) SE Runtime Environment (build 1.8.0_151-b12)
Java HotSpot(TM) 64-Bit Server VM (build 25.151-b12, mixed mode)
More diagnostic information in the attachments (we have created screenshots and ThreadDumps not at the same time, but at a time when we have seen the problem). |