humann2_barplot sample labels not displayed
47 views
Skip to first unread message

utritala
Aug 6, 2019, 11:49:31 AM8/6/19
to HUMAnN Users
Hello,
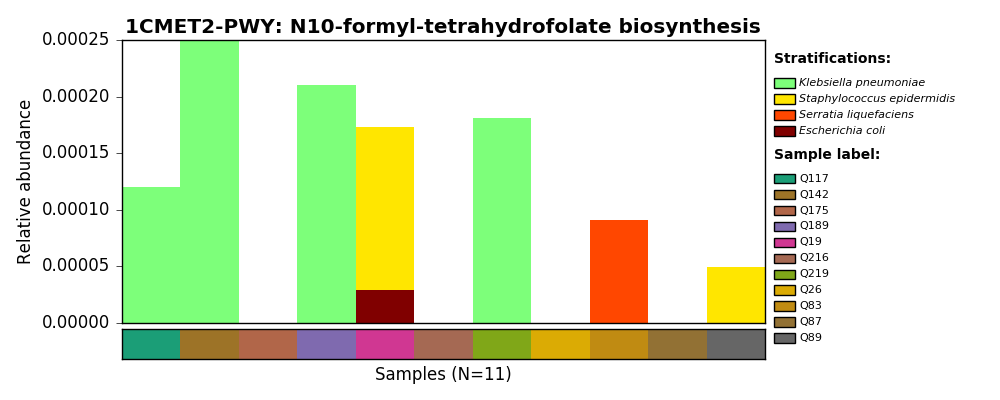
I am trying to use humann2_barplot but the sample labels are not displayed.
My input file and the output image is attached with this email. Here is my command:
humann2_barplot -i all_samples_pathabundances_humann2_relab_stratified_for_plotting.pcl -f 1CMET2-PWY --focal-metadatum Infant --output all_samples_pathabundances_humann2_relab_stratified_humann2_barplot2.png
Any help you could provide will be great.
Many thanks.

Eric Franzosa
Aug 6, 2019, 2:58:51 PM8/6/19
to humann...@googlegroups.com
It looks like I didn't include labeling the samples as an option since the tool was benchmarked on very large datasets (where labels would be inconvenient). I'll note it as something to add for a future release. The best (very sub-optimal) solution for now would be to include the sample labels as a metadata row.
Thanks,
Eric
--
You received this message because you are subscribed to the Google Groups "HUMAnN Users" group.
To unsubscribe from this group and stop receiving emails from it, send an email to humann-users...@googlegroups.com.
To view this discussion on the web visit https://groups.google.com/d/msgid/humann-users/bf5ba74d-7af9-4025-987d-1f4a25de0eaa%40googlegroups.com.
Urmi
Aug 7, 2019, 4:58:29 AM8/7/19
to HUMAnN Users
Thanks Eric. I have already put in samples (shown as "Infant") as metadata row. For example:
#FEATURE Q117 Q142 Q175 Q189 Q19 Q216 Q219 Q26 Q83 Q87 Q89
#Infant Q117 Q142 Q175 Q189 Q19 Q216 Q219 Q26 Q83 Q87 Q89
UNINTEGRATED|g__Bifidobacterium.s__Bifidobacterium_breve 0 0 0 0 0 0 0.250506 0.324136 0 0.698905 0
But the results still stay the same. Please correct me if I am wrong.
On Tuesday, August 6, 2019 at 7:58:51 PM UTC+1, Eric Franzosa wrote:
It looks like I didn't include labeling the samples as an option since the tool was benchmarked on very large datasets (where labels would be inconvenient). I'll note it as something to add for a future release. The best (very sub-optimal) solution for now would be to include the sample labels as a metadata row.Thanks,Eric
On Tue, Aug 6, 2019 at 11:49 AM utritala <urm...@gmail.com> wrote:
Hello,--I am trying to use humann2_barplot but the sample labels are not displayed.My input file and the output image is attached with this email. Here is my command:humann2_barplot -i all_samples_pathabundances_humann2_relab_stratified_for_plotting.pcl -f 1CMET2-PWY --focal-metadatum Infant --output all_samples_pathabundances_humann2_relab_stratified_humann2_barplot2.pngAny help you could provide will be great.Many thanks.
You received this message because you are subscribed to the Google Groups "HUMAnN Users" group.
To unsubscribe from this group and stop receiving emails from it, send an email to humann...@googlegroups.com.

John G
Oct 7, 2019, 10:58:48 AM10/7/19
to HUMAnN Users
Hi Eric,
Is there any way you can send a
hack to accomplish this task, even if privately? I'd also like to get
the samples on the x-axis and ideally I'd be able to do so in the next
week. I've made my way through the script that accomplishes this task,
but there is a lot going on that my non-coding brain has difficulty
wrapping around. My guess is that for someone more familiar with
scripting it wouldn't be a huge change?
On Tuesday, August 6, 2019 at 11:58:51 AM UTC-7, Eric Franzosa wrote:
It looks like I didn't include labeling the samples as an option since the tool was benchmarked on very large datasets (where labels would be inconvenient). I'll note it as something to add for a future release. The best (very sub-optimal) solution for now would be to include the sample labels as a metadata row.Thanks,Eric
On Tue, Aug 6, 2019 at 11:49 AM utritala <urm...@gmail.com> wrote:
Hello,--I am trying to use humann2_barplot but the sample labels are not displayed.My input file and the output image is attached with this email. Here is my command:humann2_barplot -i all_samples_pathabundances_humann2_relab_stratified_for_plotting.pcl -f 1CMET2-PWY --focal-metadatum Infant --output all_samples_pathabundances_humann2_relab_stratified_humann2_barplot2.pngAny help you could provide will be great.Many thanks.
You received this message because you are subscribed to the Google Groups "HUMAnN Users" group.
To unsubscribe from this group and stop receiving emails from it, send an email to humann...@googlegroups.com.
Eric Franzosa
Oct 9, 2019, 1:40:34 PM10/9/19
to humann...@googlegroups.com
You might be hitting an issue because of the #s in the feature names. The following command worked for me (note the use of \ for escape):
humann2_barplot -i test.pcl -l \#Infant -m \#Infant -f 1CMET2-PWY -o test.png
(I renamed your input to test.pcl.) This produced the attached graphic.
Thanks,
Eric
To unsubscribe from this group and stop receiving emails from it, send an email to humann-users...@googlegroups.com.
To view this discussion on the web visit https://groups.google.com/d/msgid/humann-users/da103efd-ec8a-474e-837f-38cf97668d21%40googlegroups.com.
John G
Oct 14, 2019, 4:25:06 PM10/14/19
to HUMAnN Users
Hi Eric,
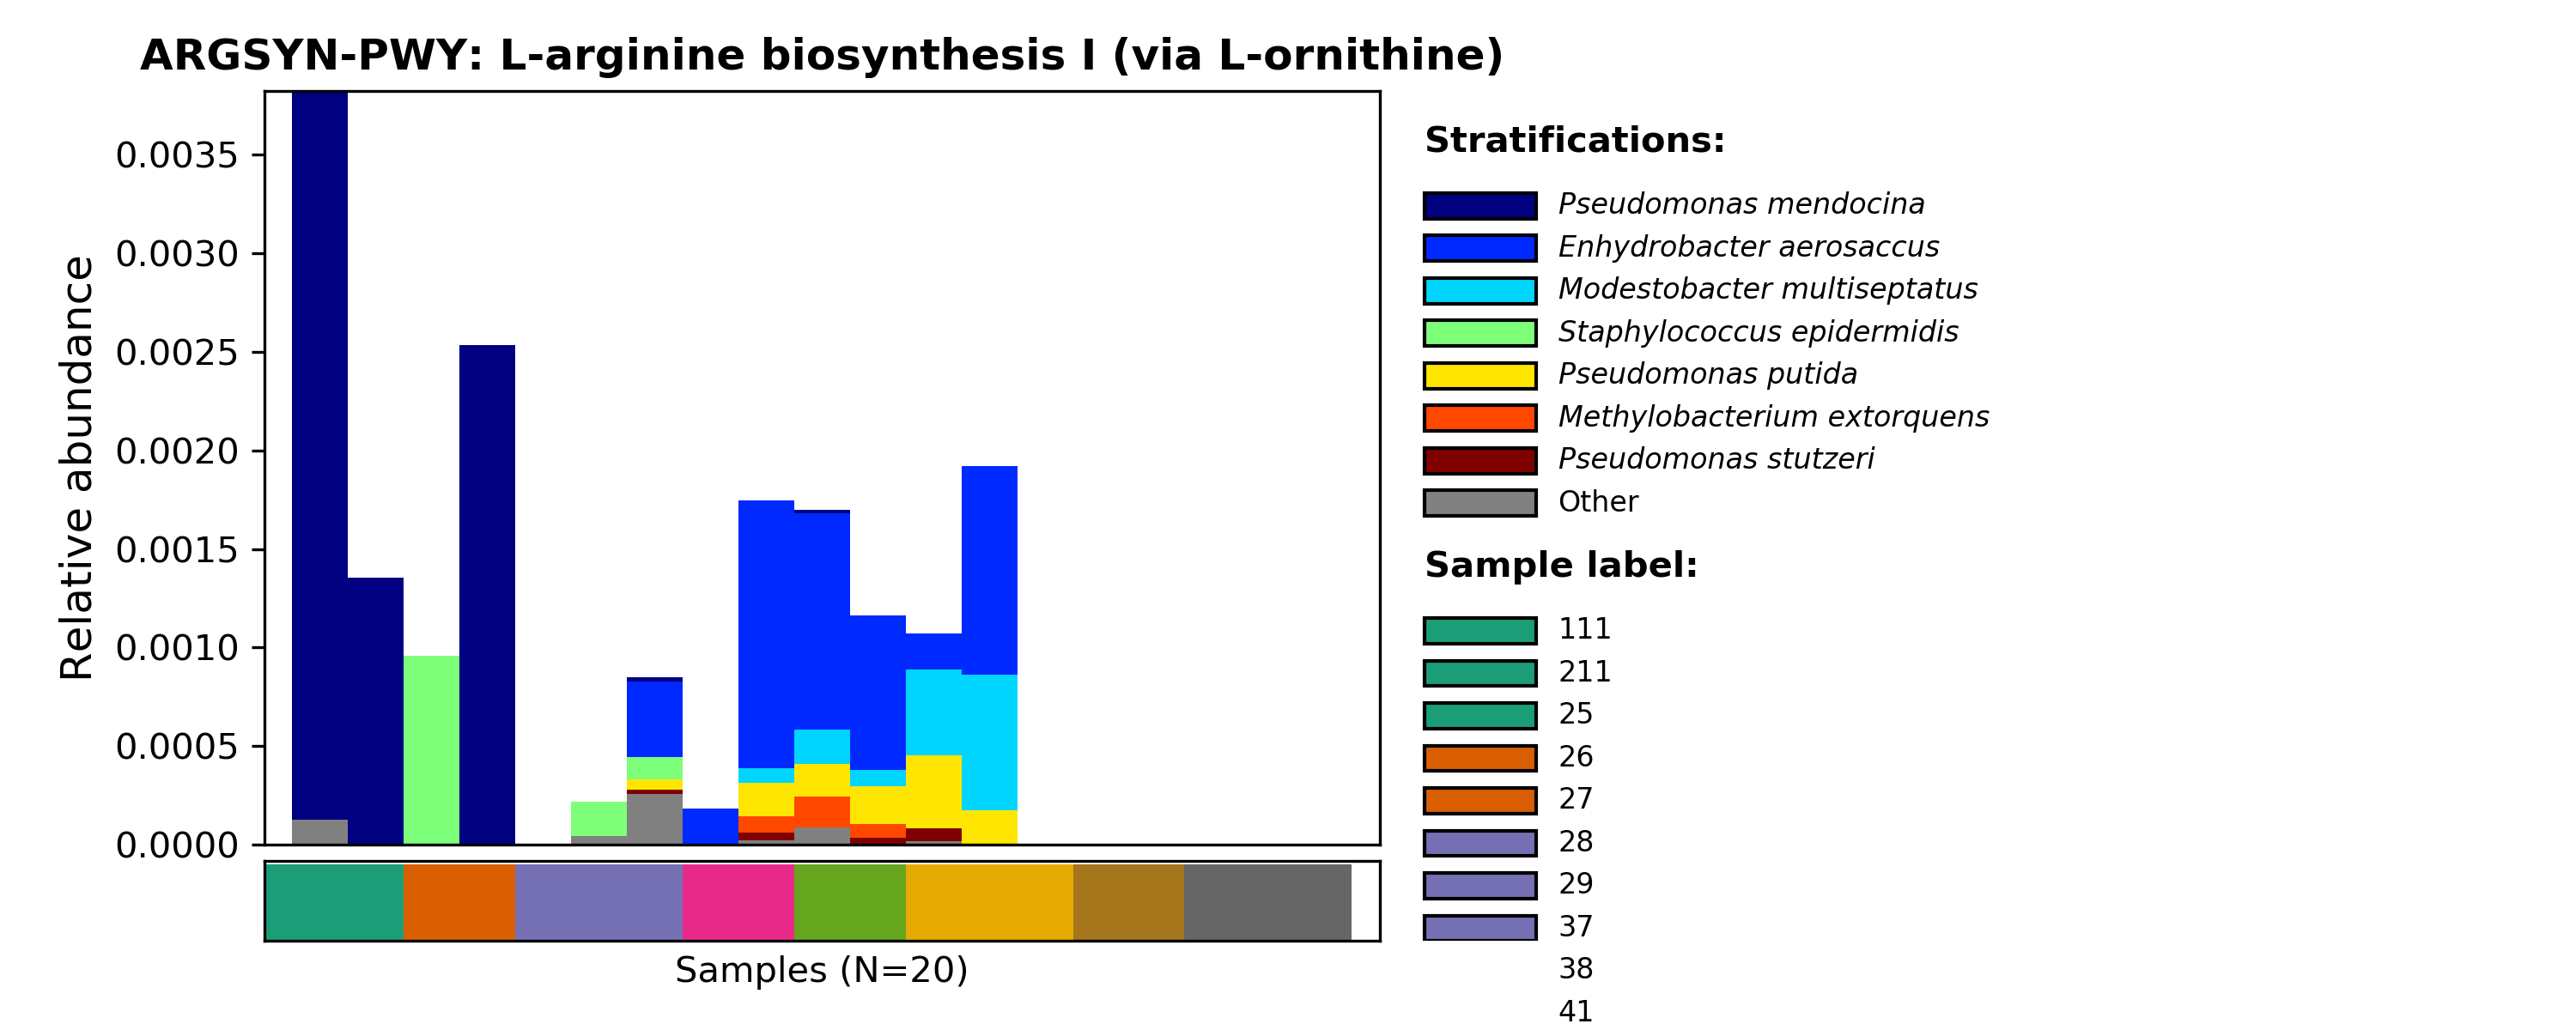
I was able to get this approach to work, but I have 12 samples and it appears the color map is rather small as there are colors overlapping (see attached). I don't see the options for colormap, but was hoping to find a scale that would encompass a greater range. I'll dig into matplotlib color palettes a bit as I assume it is in there (??), but if you could get back to me that would be great. Also, I can't get all 20 in the legend without going off the bottom. I've messed around with the various spacing options, but none seem to suffice. So if you have any thoughts on that topic, as well, that would be great. Finally, is there a reason the leftmost bar is half the size of all the others? That doesn't seem to be the case with your image.
humann2_barplot --input input.tsv --focal-feature ARGSYN-PWY --output ARGSYN-PWY-out -l \#sampleID -m \#sampleID -x -z
I'm using humann2-0.11.2
John
To view this discussion on the web visit https://groups.google.com/d/msgid/humann-users/da103efd-ec8a-474e-837f-38cf97668d21%40googlegroups.com.
Reply all
Reply to author
Forward
0 new messages