ValueError: need more than 1 value to unpack when running humann2_barplot on stratified pathway abundance table
20 views
Skip to first unread message

Angel Dai
Oct 15, 2019, 9:02:45 PM10/15/19
to HUMAnN Users
Hi,
on my relab normalized stratified pathway abundance table, I got the ValueError: need more than 1 value to unpack error.
When I try to run
Enter code here...
humann2_barplot  \
--input ../data/humann2_res/humann2_final_out/humann2_pathabundance_relab_stratified_reordered_with_tox.pcl \
--focal-feature PWY-4242 \
--sort similarity metadata \
--focal-metadatum Toxicity --last-metadatum Toxicity \
--scaling pseudolog \
--dimensions 10 5 \
-o ../figs/PWY-4242_pw.png
on my relab normalized stratified pathway abundance table, I got the ValueError: need more than 1 value to unpack error.
But I'm using the stratified result, and I have tried with no metadata info, and it would run.
I don't know why adding metadata info it couldn't run.
I've attached one sample input table for your reference.
Could you identify what was causing the reason?
Thank you!
Angel

Eric Franzosa
Oct 16, 2019, 12:15:39 PM10/16/19
to humann...@googlegroups.com
The test table you sent appears to be missing headers?
Thanks,
Eric
--
You received this message because you are subscribed to the Google Groups "HUMAnN Users" group.
To unsubscribe from this group and stop receiving emails from it, send an email to humann-users...@googlegroups.com.
To view this discussion on the web visit https://groups.google.com/d/msgid/humann-users/35aa0228-03b2-45e5-bcd3-16409fa09ba2%40googlegroups.com.
Dai, Anqi
Oct 16, 2019, 5:23:02 PM10/16/19
to humann...@googlegroups.com
It will fail with or without headers
Also on this page, the table that worked has no header
at the
Basic visualizations of HUMAnN2 output
part
From: humann...@googlegroups.com <humann...@googlegroups.com> on behalf of Eric Franzosa <fran...@hsph.harvard.edu>
Sent: Wednesday, October 16, 2019 12:15 PM
To: humann...@googlegroups.com <humann...@googlegroups.com>
Subject: Re: ValueError: need more than 1 value to unpack when running humann2_barplot on stratified pathway abundance table
Sent: Wednesday, October 16, 2019 12:15 PM
To: humann...@googlegroups.com <humann...@googlegroups.com>
Subject: Re: ValueError: need more than 1 value to unpack when running humann2_barplot on stratified pathway abundance table
To view this discussion on the web visit
https://groups.google.com/d/msgid/humann-users/CAC%3DWeKobqNq2W3XGhBg_Qj3eGJMCNtohHfs2y3C3-UU_gcO-SA%40mail.gmail.com.
Eric Franzosa
Oct 17, 2019, 2:43:47 PM10/17/19
to humann...@googlegroups.com
I can't speak to that tutorial since we did not develop it.
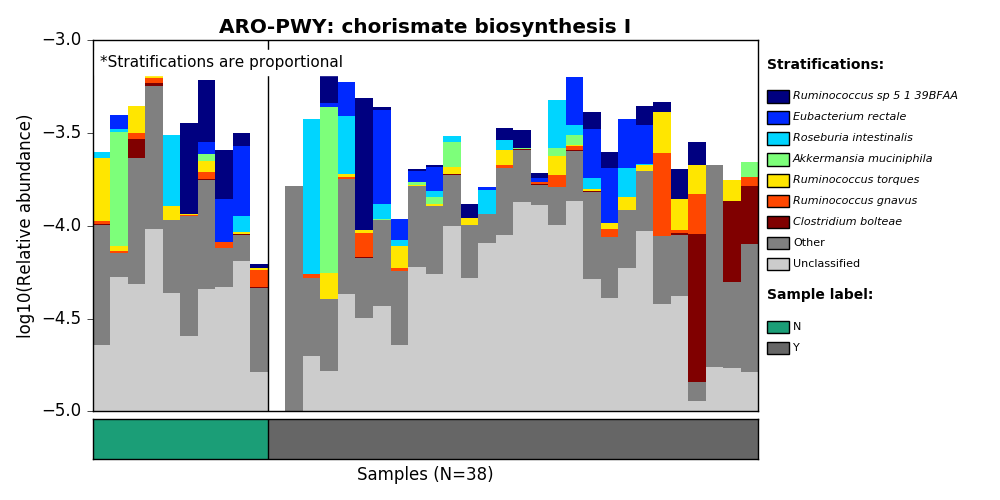
The attached version of your table with headers runs with the attached command and produces the attached figure.
Thanks,
Eric
To view this discussion on the web visit https://groups.google.com/d/msgid/humann-users/BN6PR03MB3172AD6E618679A58C6B210BBA920%40BN6PR03MB3172.namprd03.prod.outlook.com.
Dai, Anqi
Oct 17, 2019, 10:12:25 PM10/17/19
to humann...@googlegroups.com
Oh so the sample id is in the first row, I put it in the row after the phenotype like lefse asked.
Thank you so much for helping out!!
Angel
From: humann...@googlegroups.com <humann...@googlegroups.com> on behalf of Eric Franzosa <fran...@hsph.harvard.edu>
Sent: Thursday, October 17, 2019 2:43 PM
To view this discussion on the web visit
https://groups.google.com/d/msgid/humann-users/CAC%3DWeKohu6zRCgcKwmk7Qs7%2Bmn3Kzqnk%2B-UOyjVW1sqoH5S45Q%40mail.gmail.com.
Reply all
Reply to author
Forward
0 new messages