Lightning Stroke/TLE Analysis with VLF Receiver (Post with Missing Images)

Jonathan


Kerry Case
Very interesting. Is the light strokes at the area of the Luminous or is it miles away?
Kerry
N1URT
Sent from Mail for Windows
From: Jonathan
Sent: Friday, January 27, 2023 9:35 AM
To: Unknown;
TangerineSDR Listserv
Subject: [HamSCI] Lightning Stroke/TLE Analysis with VLF Receiver (Post with Missing Images)
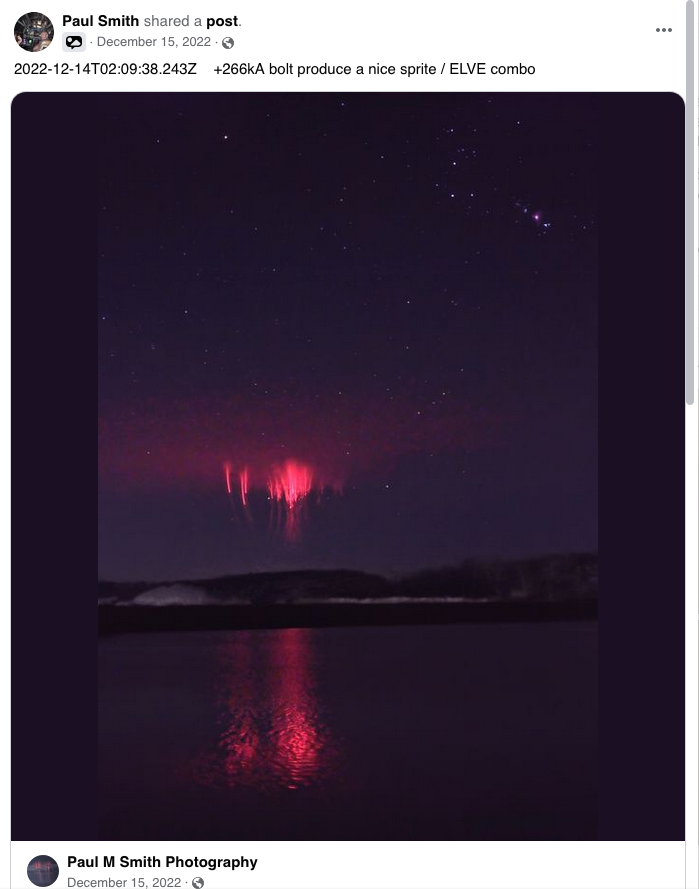
Sometimes lightning strokes produce what are called transient luminous events, or TLEs. They are commonly known as sprites and jets. Not much is known about them but they are continuously studied. Columns and regions of atmosphere are ionized so much by the electric potentials caused by the lightning stroke that the air glows red. It’s present for a split second when the stroke occurs, so you need a quick eye and a camera to capture an image. Many enthusiasts who capture these beautiful events often use timed video and photography and use lightning stroke data to identify the specific lightning stroke, its channel current, and polarity. The "channel" is the conductive channel of ionized air where lightning current either flows upwards or downwards. VLF receivers detect the radio emissions from lightning strokes, called sferics. The sferic signal characteristics are fed into models that calculate stroke polarity and channel current.
An enthusiast and photographer, Paul, captured a double TLE, showing both a sprite (the dendritic structure) and an ELVE (the upper dim region of red glowing air above the sprite). ELVEs are often, but not always, indicative of what is called a "continuing current", or a residual current flowing through the channel with ELF frequency components.

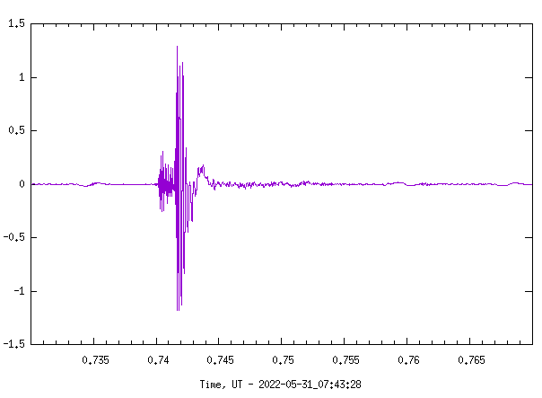
Using a VLF receiver connected to a soundcard and vlfrx-tools software, it is possible to look at the sferic's impulse in a time domain plot. A continuing current will often show up as an "ELF tail" right after the initial impulse. This tail has ELF frequency components and is indicative of that "little wavy line" after the sferic's impulse. The plot below shows the sferic from the stroke that created the TLE above. The ELF tail is hard to see because it has some high frequency components on it, but it is there. Running the following signal processing chain in vlfrx-tools software produced the plot below:
vtread -T2022-12-14_02:09:20,+30s /data/vlf_96k | vtfilter -a th=5 | vtresample -r32000 | vtcat -T2022-12-14_02:09:38.2,+0.1 | vtplot -t "+266kA Stroke Nice Sprite/ELVE Combo"

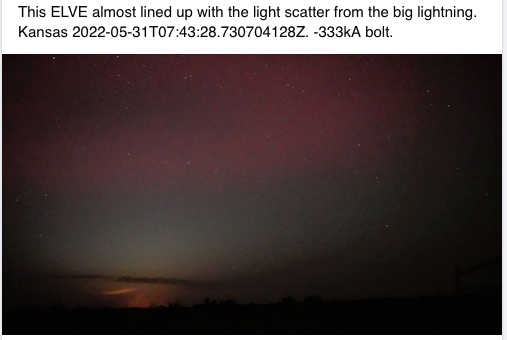
The farther the VLF receiver is from the lightning stroke, the longer the ELF tail is. If this stroke occurred in Europe, it would be much longer, but it was captured in the US, closer to the VLF receiver. Here is another example of an ELVE:

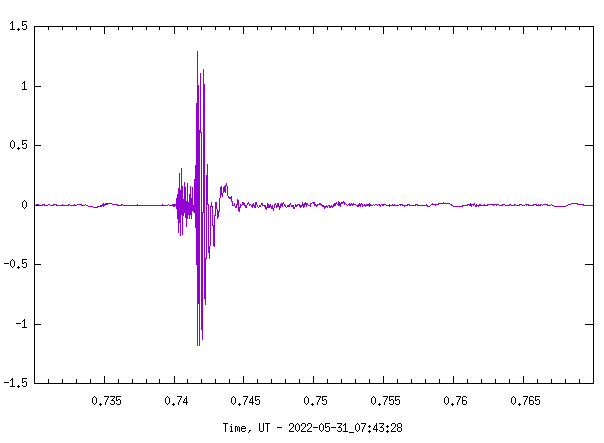
This is the time domain plot with the ELF tail easier to see because there are much less high frequency components:
In recording these millisecond events, it is essential to use precision timing, which is why I use a GPS receiver to enable accurate and precision timestamping. I used the signal processing chain above to pull the spectrum data from the data store, filter out mains hum, resample to 32k to remove a lot of high frequency components, then feed the specific spectrum chunk into the plotting program.
With vlfrx-tools software and a network of VLF receivers, you can do lightning location as well. Here is a lightning map from a network of VLF receivers in India:

The red dots indicate the location of a stroke and the circles indicate VLF receiver locations.
Eventually, I would like to have a network of VLF receivers collecting sferic data for lightning location.
Jonathan
KC3EEY
--
Please follow the HamSCI Community Participation Guidelines at
http://hamsci.org/hamsci-community-participation-guidelines.
---
You received this message because you are subscribed to the Google Groups "HamSCI" group.
To unsubscribe from this group and stop receiving emails from it, send an email to
hamsci+un...@googlegroups.com.
To view this discussion on the web visit
https://groups.google.com/d/msgid/hamsci/CAOY0kB1ObgqciLJcBmJKJuq2VpxdJ7n-C%2BQeQbCx-pSMOXa4qA%40mail.gmail.com.

Gerald Creager
Maj Gerry Creager
National Health Services Advisory Team
Civil Air Patrol, U.S. Air Force Auxiliary
(M) 979.229.5301
Volunteers serving America's communities, saving lives, and shaping futures.

--
Jonathan
To view this discussion on the web visit https://groups.google.com/d/msgid/hamsci/CAG3zga4uy-pmvv_K2BhxxDF9OAijw1VRdehqi0YaLsVAW4XueA%40mail.gmail.com.
Kerry Case
Roger that understand now That is cool stuff
K

Using a VLF receiver connected to a soundcard and vlfrx-tools software, it is possible to look at the sferic's impulse in a time domain plot. A continuing current will often show up as an "ELF tail" right after the initial impulse. This tail has ELF frequency components and is indicative of that "little wavy line" after the sferic's impulse. The plot below shows the sferic from the stroke that created the TLE above. The ELF tail is hard to see because it has some high frequency components on it, but it is there. Running the following signal processing chain in vlfrx-tools software produced the plot below:
vtread -T2022-12-14_02:09:20,+30s /data/vlf_96k | vtfilter -a th=5 | vtresample -r32000 | vtcat -T2022-12-14_02:09:38.2,+0.1 | vtplot -t "+266kA Stroke Nice Sprite/ELVE Combo"

The farther the VLF receiver is from the lightning stroke, the longer the ELF tail is. If this stroke occurred in Europe, it would be much longer, but it was captured in the US, closer to the VLF receiver. Here is another example of an ELVE:
This is the time domain plot with the ELF tail easier to see because there are much less high frequency components:

In recording these millisecond events, it is essential to use precision timing, which is why I use a GPS receiver to enable accurate and precision timestamping. I used the signal processing chain above to pull the spectrum data from the data store, filter out mains hum, resample to 32k to remove a lot of high frequency components, then feed the specific spectrum chunk into the plotting program.
With vlfrx-tools software and a network of VLF receivers, you can do lightning location as well. Here is a lightning map from a network of VLF receivers in India:

The red dots indicate the location of a stroke and the circles indicate VLF receiver locations.
Eventually, I would like to have a network of VLF receivers collecting sferic data for lightning location.
Jonathan
KC3EEY
--
Please follow the HamSCI Community Participation Guidelines at http://hamsci.org/hamsci-community-participation-guidelines.
---
You received this message because you are subscribed to the Google Groups "HamSCI" group.
To unsubscribe from this group and stop receiving emails from it, send an email to hamsci+un...@googlegroups.com.
To view this discussion on the web visit https://groups.google.com/d/msgid/hamsci/CAOY0kB1ObgqciLJcBmJKJuq2VpxdJ7n-C%2BQeQbCx-pSMOXa4qA%40mail.gmail.com.
--
Please follow the HamSCI Community Participation Guidelines at http://hamsci.org/hamsci-community-participation-guidelines.
---
You received this message because you are subscribed to the Google Groups "HamSCI" group.
To unsubscribe from this group and stop receiving emails from it, send an email to hamsci+un...@googlegroups.com.
To view this discussion on the web visit https://groups.google.com/d/msgid/hamsci/CAG3zga4uy-pmvv_K2BhxxDF9OAijw1VRdehqi0YaLsVAW4XueA%40mail.gmail.com.
--
Please follow the HamSCI Community Participation Guidelines at
http://hamsci.org/hamsci-community-participation-guidelines.
---
You received this message because you are subscribed to the Google Groups "HamSCI" group.
To unsubscribe from this group and stop receiving emails from it, send an email to
hamsci+un...@googlegroups.com.
To view this discussion on the web visit https://groups.google.com/d/msgid/hamsci/CAOY0kB2HPk9jxq7Gc-9J9CFPjS1mFLeVQEsc-jSFtFJFi5jKXg%40mail.gmail.com.

Stephen Kangas
And for photographic proof, refer to the Twilight Zone movie of 1983 where John Lithgow sees one, or at least some distant relative.
Stephen W9SK
From: ham...@googlegroups.com <ham...@googlegroups.com> On Behalf Of Jonathan
Sent: Friday, January 27, 2023 9:42 AM
To: ham...@googlegroups.com; TangerineSDR Listserv <tanger...@lists.tapr.org>
Subject: Re: [HamSCI] Lightning Stroke/TLE Analysis with VLF Receiver (Post with Missing Images)
Kerry,
ELVES and sprites occur in the mesosphere above thunderstorms.
Gerry,
I'm still looking to create a network of VLF receivers and one of the functions would be lightning location. Other than impulse duration, what are the characteristics of a CG and intracloud stroke at VLF and how would distance from the receiver affect that? The vlfrx-tools software I use is very versatile in terms of signal processing, so what were you looking to do?
Jonathan
KC3EEY
On Fri, Jan 27, 2023 at 10:35 AM Gerald Creager <gcre...@cap.gov> wrote:
Jonathon,
Your network of receivers is similar in concept to the network I presented several years ago at the TAPR DCC. Let's talk. Your ELF tail and EVLE work suggest some things to me. A lot of work has been done in other spectral ranges than VLF, and there are data to capture at higher frequencies. Think "Citizen Weather Observer Network" but for lightning. I've also got some ideas on central processing for geolocation for GC and CC/IC impulses.
73
Gerry N5JXS
Maj Gerry Creager
National Health Services Advisory Team
Civil Air Patrol, U.S. Air Force Auxiliary
(M) 979.229.5301
Volunteers serving America's communities, saving lives, and shaping futures.
On Fri, Jan 27, 2023 at 7:35 AM Jonathan <emum...@gmail.com> wrote:
Sometimes lightning strokes produce what are called transient luminous events, or TLEs. They are commonly known as sprites and jets. Not much is known about them but they are continuously studied. Columns and regions of atmosphere are ionized so much by the electric potentials caused by the lightning stroke that the air glows red. It’s present for a split second when the stroke occurs, so you need a quick eye and a camera to capture an image. Many enthusiasts who capture these beautiful events often use timed video and photography and use lightning stroke data to identify the specific lightning stroke, its channel current, and polarity. The "channel" is the conductive channel of ionized air where lightning current either flows upwards or downwards. VLF receivers detect the radio emissions from lightning strokes, called sferics. The sferic signal characteristics are fed into models that calculate stroke polarity and channel current.
An enthusiast and photographer, Paul, captured a double TLE, showing both a sprite (the dendritic structure) and an ELVE (the upper dim region of red glowing air above the sprite). ELVEs are often, but not always, indicative of what is called a "continuing current", or a residual current flowing through the channel with ELF frequency components.

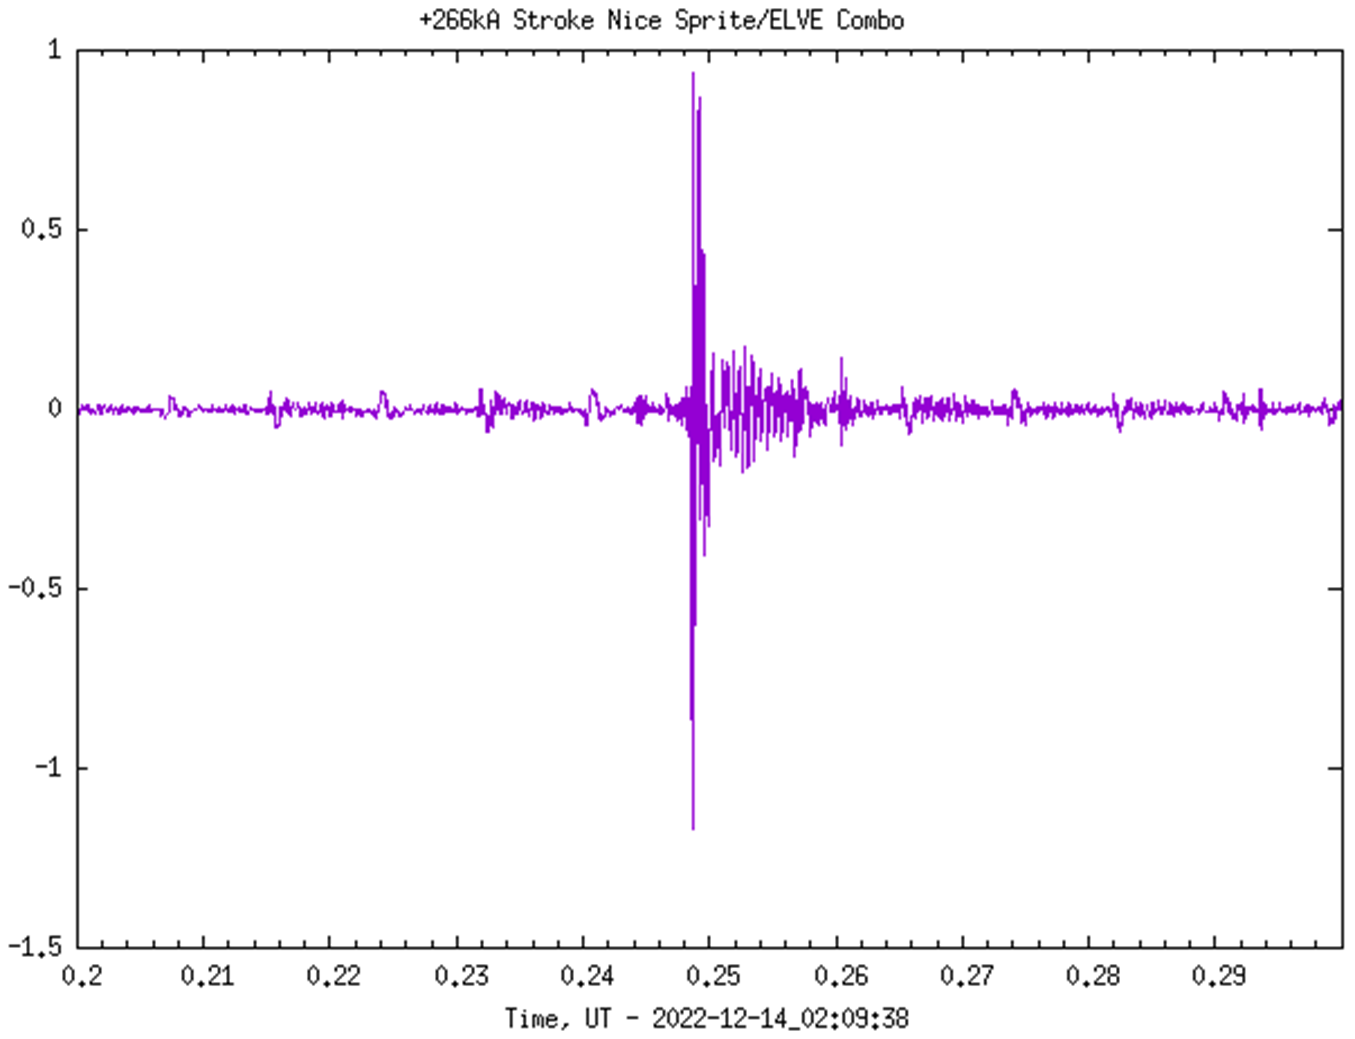
Using a VLF receiver connected to a soundcard and vlfrx-tools software, it is possible to look at the sferic's impulse in a time domain plot. A continuing current will often show up as an "ELF tail" right after the initial impulse. This tail has ELF frequency components and is indicative of that "little wavy line" after the sferic's impulse. The plot below shows the sferic from the stroke that created the TLE above. The ELF tail is hard to see because it has some high frequency components on it, but it is there. Running the following signal processing chain in vlfrx-tools software produced the plot below:
vtread -T2022-12-14_02:09:20,+30s /data/vlf_96k | vtfilter -a th=5 | vtresample -r32000 | vtcat -T2022-12-14_02:09:38.2,+0.1 | vtplot -t "+266kA Stroke Nice Sprite/ELVE Combo"

The farther the VLF receiver is from the lightning stroke, the longer the ELF tail is. If this stroke occurred in Europe, it would be much longer, but it was captured in the US, closer to the VLF receiver. Here is another example of an ELVE:

This is the time domain plot with the ELF tail easier to see because there are much less high frequency components:

In recording these millisecond events, it is essential to use precision timing, which is why I use a GPS receiver to enable accurate and precision timestamping. I used the signal processing chain above to pull the spectrum data from the data store, filter out mains hum, resample to 32k to remove a lot of high frequency components, then feed the specific spectrum chunk into the plotting program.
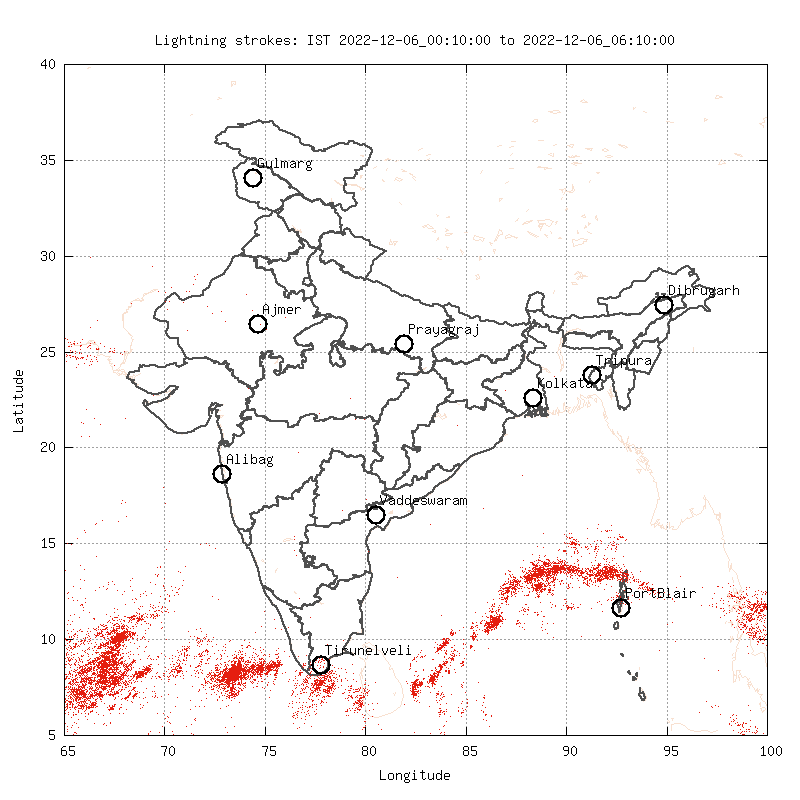
With vlfrx-tools software and a network of VLF receivers, you can do lightning location as well. Here is a lightning map from a network of VLF receivers in India:

The red dots indicate the location of a stroke and the circles indicate VLF receiver locations.
Eventually, I would like to have a network of VLF receivers collecting sferic data for lightning location.
Jonathan
KC3EEY
--
Please follow the HamSCI Community Participation Guidelines at http://hamsci.org/hamsci-community-participation-guidelines.
---
You received this message because you are subscribed to the Google Groups "HamSCI" group.
To unsubscribe from this group and stop receiving emails from it, send an email to hamsci+un...@googlegroups.com.
To view this discussion on the web visit https://groups.google.com/d/msgid/hamsci/CAOY0kB1ObgqciLJcBmJKJuq2VpxdJ7n-C%2BQeQbCx-pSMOXa4qA%40mail.gmail.com.
--
Please follow the HamSCI Community Participation Guidelines at http://hamsci.org/hamsci-community-participation-guidelines.
---
You received this message because you are subscribed to the Google Groups "HamSCI" group.
To unsubscribe from this group and stop receiving emails from it, send an email to hamsci+un...@googlegroups.com.
To view this discussion on the web visit https://groups.google.com/d/msgid/hamsci/CAG3zga4uy-pmvv_K2BhxxDF9OAijw1VRdehqi0YaLsVAW4XueA%40mail.gmail.com.
--
Please follow the HamSCI Community Participation Guidelines at http://hamsci.org/hamsci-community-participation-guidelines.
---
You received this message because you are subscribed to the Google Groups "HamSCI" group.
To unsubscribe from this group and stop receiving emails from it, send an email to hamsci+un...@googlegroups.com.
To view this discussion on the web visit https://groups.google.com/d/msgid/hamsci/CAOY0kB2HPk9jxq7Gc-9J9CFPjS1mFLeVQEsc-jSFtFJFi5jKXg%40mail.gmail.com.

kunde...@tbsys.com
Hello All:
I am a heretofore silent observer of the hamsci group and Tangerine conversations. I am also a ham radio operator (K8ZTV) and a Meteorologist.
I have a Meteorologist friend who has been researching and observing Sprites for years. He is a past President of the American Meteorological Society. His website is:
https://www.weathervideohd.tv/wvhd.php?mod=search&sev=68123&sp=1
I hope that you find his website interest and informative.
Ken
Kenneth H. Underwood, Ph.D., CCM (#466)
Santa Clarita, CA 91350
661-965-9621 (cell)
661-309-6225 (office)
661-309-6229 (fax)
To view this discussion on the web visit https://groups.google.com/d/msgid/hamsci/0f9001d93279%24c66c05a0%24534410e0%24%40kangas.com.

Gerry Creager
To view this discussion on the web visit https://groups.google.com/d/msgid/hamsci/00bd01d93296%2477e52750%2467af75f0%24%40tbsys.com.

Robert McGwier
To view this discussion on the web visit https://groups.google.com/d/msgid/hamsci/CAOY0kB2HPk9jxq7Gc-9J9CFPjS1mFLeVQEsc-jSFtFJFi5jKXg%40mail.gmail.com.
Adjunct Faculty, Virginia Tech
ARDC Member of Board
N4HY: ARRL, TAPR, AMSAT, EARC, CSVHFS
Sky: AAVSO, Sky360, explorescu.org, Skyscrapers
Jonathan
To view this discussion on the web visit https://groups.google.com/d/msgid/hamsci/CA%2BK5gzdTiNv36FArMNNYr5ruGmzV_yS%3Dk%2B_p5U-nCEo3ShiUNQ%40mail.gmail.com.
Gerald Creager
Maj Gerry Creager
National Health Services Advisory Team
Civil Air Patrol, U.S. Air Force Auxiliary
(M) 979.229.5301
Volunteers serving America's communities, saving lives, and shaping futures.
To view this discussion on the web visit https://groups.google.com/d/msgid/hamsci/CAOY0kB2L6ERNK7vaa9B219csQme%3DWENnhzkg1hPH9ZoYzq4sGQ%40mail.gmail.com.
Jonathan
To view this discussion on the web visit https://groups.google.com/d/msgid/hamsci/CAG3zga7hg%2B69NRrvYa8A5mOpKVWZs95sE5%3Dks9H%2Bo547swfkSA%40mail.gmail.com.
Jonathan
Gerry Creager
Gerry,What frequency bands will be required for characterization then? If you're talking about HF and higher, you need a much denser network of receivers that are within short range to the lightning and some sophisticated autonomy to collect the waveforms and then perform trilateration. If the trilateration produces a good solution, it's most likely a stroke, but you need a lot of receivers and a lot of data will be produced. Once characterization is complete, will these HF and higher stations still be required or will VLF be adequate?
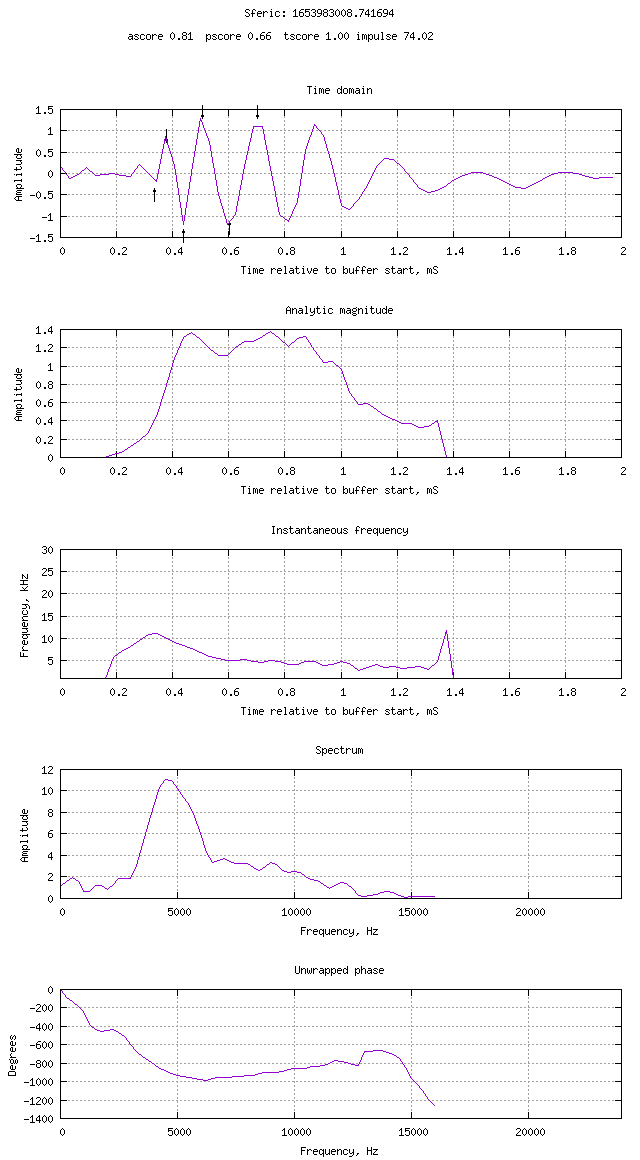
TOGA is a proven method for lightning location and it is utilized by many lightning location networks. vttoga of vlfrx-tools is particularly useful in that it can produce a lot of useful information from a sferic. It utilizes a scoring system to determine if an impulse is "sferic-like", however, the additional useful information can be used to further identify the sferic, possibly CG and intracloud.
Here is an example of the sferic captured at my receiver in Pennsylvania originating from the -333kA stroke and ELVES event in May of last year in Kansas. Below is the sferic's time domain plot:Running that narrow slice of spectrum into vttoga produces an output of two TOGAs, one being the real one and one a false detection. Using vttoga's options to produce extended measurements and a plotting script produces the following:If you look at the image, you can see the plot title includes the sferic's TOGA and the various scoring based on how "sferic-like" it is. (see vttoga's documentation for more information) The top plot is a time domain plot showing the groundwave and successive skywaves. The second plot is the analytic magnitude which removes all phase information from the sferic's signal. The third plot is the instantaneous frequency computed from the analytic magnitude. The fourth plot is the frequency spectrum of the sferic, showing the peak at less than 5 kHz. Lastly, the fifth plot is the unwrapped absolute phase as a function of frequency.Using vttoga's extended data option, it can be possible to characterize sferics and even differentiate from local interference. See the post here for more information. As you can see from Paul's remarks, sferics are difficult to identify and characterize.Would this sort of analysis be useful?


To view this discussion on the web visit https://groups.google.com/d/msgid/hamsci/CAOY0kB20TdA0yXKs9J%3DHi97UWjMUTZ9hhBVEpYghnya8AgkQ%2BQ%40mail.gmail.com.
Jonathan
To view this discussion on the web visit https://groups.google.com/d/msgid/hamsci/CAMyi%2BGP%3DRa0Z2RiVNaY7XXvtsaEODov0Pr3H-SODEr_F%3D%2BBnbg%40mail.gmail.com.
Gerald Creager
To view this discussion on the web visit https://groups.google.com/d/msgid/hamsci/CAOY0kB2JY%3D-tycynd0pScPQP-a0x8BrPfS3vq6G_so3LDLtUdw%40mail.gmail.com.