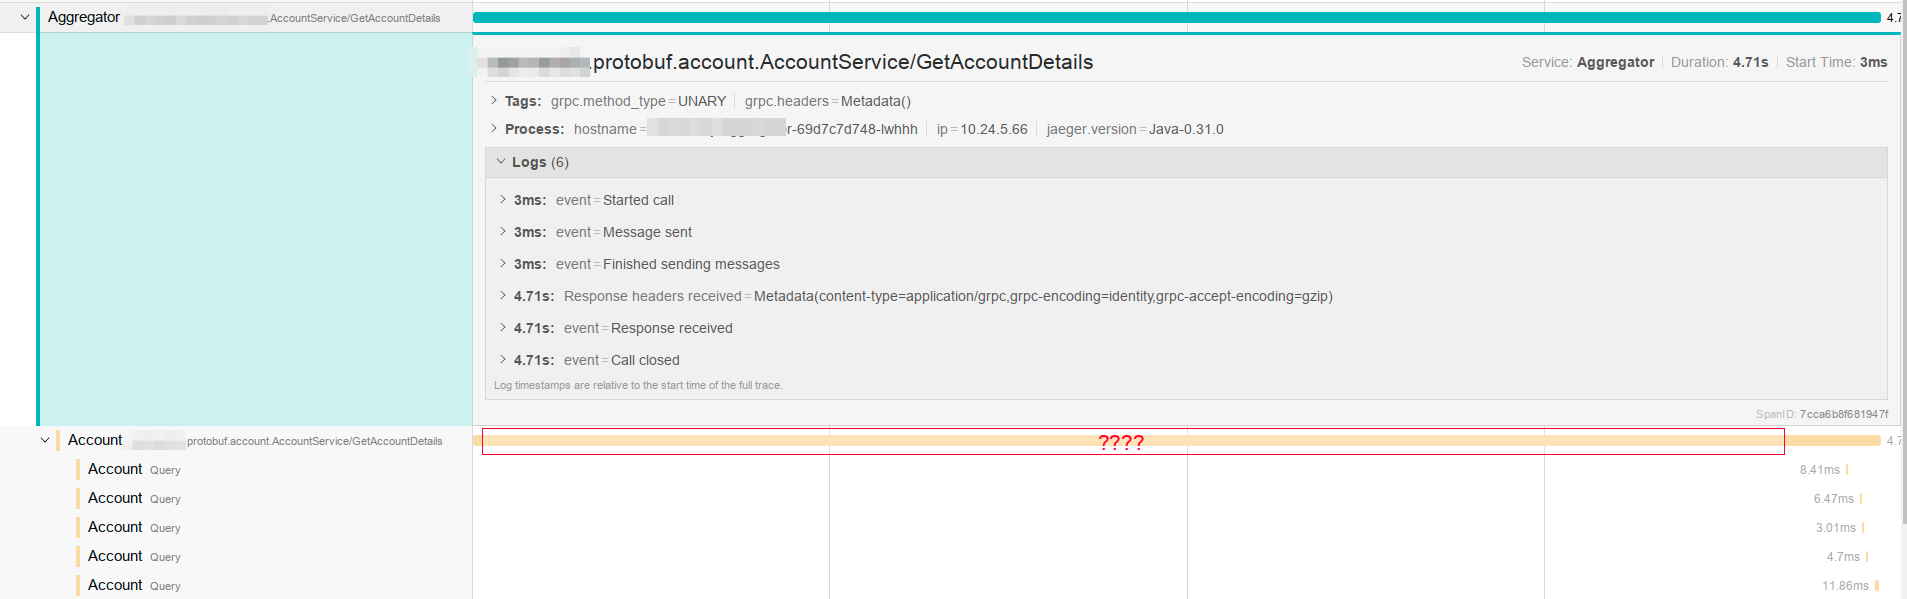
[gRPC Java] need help to diagnose weird stall in grpc call

59 views
Skip to first unread message

ake...@pitechnologies.ro

unread,
Nov 21, 2018, 3:50:12 AM11/21/18
to grpc.io
Randomly, some gRPC calls which usually complete in 20 milliseconds take a few seconds.
We have Jager in place, traces show a few seconds where the call does nothing and then processing begins, which seems to imply queuing of some sorts? 

On the server side, we have fixed concurrency, a thread dump shows most of them idle.
Our environment: Kuberentes 1.9 on Google Cloud, services are exposed using ClusterIP: None, clients connect using DNS load balancing

- Is there some build-in queuing on the server side?
- Is there any way to track the queue depth?
- Any other tips on debugging this? 

Selection_120.png


Robert Engels

unread,
Nov 21, 2018, 8:34:20 AM11/21/18
to ake...@pitechnologies.ro, grpc.io
Maybe a full GC is occurring on the server ? That’s what I would look for. 

<Selection_120.png>


--
You received this message because you are subscribed to the Google Groups "grpc.io" group.
To unsubscribe from this group and stop receiving emails from it, send an email to grpc-io+u...@googlegroups.com.
To post to this group, send email to grp...@googlegroups.com.
Visit this group at https://groups.google.com/group/grpc-io.
To view this discussion on the web visit https://groups.google.com/d/msgid/grpc-io/3f8075e1-e261-45c9-865f-23285b98cca9%40googlegroups.com.
For more options, visit https://groups.google.com/d/optout.
<Selection_120.png>

Alexandru Keszeg

unread,
Nov 21, 2018, 9:15:41 AM11/21/18
to ren...@earthlink.net, grp...@googlegroups.com
That was my first thought as well, but monitoring doesn't show any long GC pauses. 

What seems odd is that I have not seen a "pause" between two query traces(check the attached image in the first post), only at the "start" of a request. 
--
____________________________________


Alexandru Keszeg

Developer

+40 747124216

Coratim Business Center

Campul Painii nr.3-5

Cluj Napoca ROMANIA

This message (including any attachment(s)) may be copyright-protected and/or contain privileged and confidential information intended for use by the above-mentioned recipient only.  If you are not the intended recipient of this message, then please inform the sender immediately via the telephone number, fax number or e-mail address indicated above and promptly delete this message from your system.  Any unauthorized copying, disclosure to third parties or use of this message (including any attachment(s)) is strictly prohibited.  It is generally accepted that the security of electronic communications is not failsafe. Despite our best efforts, we cannot guarantee that electronic communications received were in fact sent by the purported sender and we shall not be liable for the improper or incomplete transmission of the information contained in this communication, nor for any delay in its receipt or damage to your system.


Robert Engels

unread,
Nov 21, 2018, 9:18:33 AM11/21/18
to Alexandru Keszeg, grp...@googlegroups.com
It could be a wait for tcp connection.  If you are continually creating new connections, the server will run out of file descriptors since some connections will remain in a close wait state - so it has to wait for these to finally close in order to make a new connection. 

You might want to make sure your test is reusing connections. 

Robert Engels

unread,
Nov 21, 2018, 9:19:59 AM11/21/18
to Alexandru Keszeg, grp...@googlegroups.com
There are also ways to abort the connection to avoid the close delay. 

namle...@gmail.com

unread,
Nov 21, 2018, 10:18:26 AM11/21/18
to grpc.io

       
final NettyChannelBuilder channelBuilder = NettyChannelBuilder.forAddress(getHost(), getPort())
               
.usePlaintext(grpcProperties.isUsePlainText())
               
.loadBalancerFactory(RoundRobinLoadBalancerFactory.getInstance())
               
.intercept(getClientInterceptors());
       
        addConnectionPersistenceConfig
(channelBuilder);


if (grpcProperties.isEnableClientFixedConcurrency()) {
            channelBuilder
.executor(Executors.newFixedThreadPool(grpcProperties.getClientThreadNumber()));
       
}


this.channel = channelBuilder.build();
...

    private void addConnectionPersistenceConfig(final NettyChannelBuilder channelBuilder) {
       
if (grpcProperties.getClientKeepAlive() != 0) {
            channelBuilder
                   
.keepAliveTime(grpcProperties.getClientKeepAlive(), SECONDS) // 5
                   
.keepAliveWithoutCalls(grpcProperties.isClientKeepAliveWithoutCalls()) //true
                   
.keepAliveTimeout(grpcProperties.getClientKeepAliveTimeout(), SECONDS); //60
       
}

       
if (grpcProperties.getClientIdle() != 0) {
            channelBuilder
.idleTimeout(grpcProperties.getClientIdle(), SECONDS); //60
       
}
   
}


I have added the relevant bits of code that build the client, i think it should reuse the connection.


Another log from a client: 

112ms:
  • event=Started call
113ms:
  • event=Message sent
113ms:
  • event=Finished sending messages
5.16s:
  • Response headers received=Metadata(content-type=application/grpc,grpc-encoding=identity,grpc-accept-encoding=gzip)
5.16s:
  • event=Response received
5.16s:
  • event=Call closed


On the server side, there is no request that took more than 50ms. 


Regarding file descriptors, both the client and server have about 100 open file descriptors. 

Robert Engels

unread,
Nov 21, 2018, 10:25:48 AM11/21/18
to namle...@gmail.com, grpc.io
Are the client and server on different machines over a WAN?

Are you certain the server side isn’t blocking? I would jstack the server as soon as a delay is detected during the test. I would also run a constant ping from client to server during the test to make sure there are no network failures. 

Other than that, I think you have to enable the gRPC tracing on both sides to isolate where the hang is happening. 

Alexandru Keszeg

unread,
Nov 21, 2018, 10:54:22 AM11/21/18
to ren...@earthlink.net, Alexandru Keszeg, grp...@googlegroups.com
>  Are the client and server on different machines over a WAN?

Different machines running on Google Kubernetes service in two availability zones. 

> Are you certain the server side isn’t blocking? I would jstack the server as soon as a delay is detected during the test. I would also run a constant ping from client to server during the test to make sure there are no network failures. 

I am not running a test, I am trying to diagnose a problem in production. Randomly, 1 request in hundreds takes a few seconds.


To rephrase my question
I'm trying to find out what happened between 35ms and 5.07s. The log shows that the server receives the message after 5 seconds. Is there any way to debug this? Can I log how many requests are waiting for a connection? 


Client: 

Logs (6)
33ms:
  • event=Started call
35ms:
  • event=Message sent
35ms:
  • event=Finished sending messages
5.08s:
  • Response headers received=Metadata(content-type=application/grpc,grpc-encoding=identity,grpc-accept-encoding=gzip)
5.08s:
  • event=Response received
5.08s:
  • event=Call closed


Server: 

Logs (3)
5.07s:
  • Message received=accountIds: "facd3373-ffda-465b-8d32-50da88a4b3ab" accountIds: "f7c878c6-5c76-480b-ae54-d47ad5266344" accountIds: "ae6e4599-eb8c-4184-8ded-9317ddb2189d"
5.07s:
  • event=Client finished sending messages
5.08s:
  • event=Call completed

There is how the server threads looked at this time(sum for 5 instances):

Capture.PNG


What I would expect to see is something like this, where the time is clearly spent in the server(and there is a span not shown with a "lock" operation that takes 5 seconds)

Client: 

21ms:
  • event=Started call
22ms:
  • event=Message sent
22ms:
  • event=Finished sending messages
5.52s:
  • Response headers received=Metadata(content-type=application/grpc,grpc-encoding=identity,grpc-accept-encoding=gzip)
5.52s:
  • event=Response received
5.52s:
  • event=Call closed

Server: 
27ms:
  • Message received=username: "123" accountId: ""
27ms:
  • event=Client finished sending messages
5.52s:
  • event=Call completed


You received this message because you are subscribed to a topic in the Google Groups "grpc.io" group.
To unsubscribe from this topic, visit https://groups.google.com/d/topic/grpc-io/D2lsL82beCs/unsubscribe.
To unsubscribe from this group and all its topics, send an email to grpc-io+u...@googlegroups.com.

To post to this group, send email to grp...@googlegroups.com.
Visit this group at https://groups.google.com/group/grpc-io.

For more options, visit https://groups.google.com/d/optout.


--

Robert Engels

unread,
Nov 21, 2018, 11:19:09 AM11/21/18
to Alexandru Keszeg, Alexandru Keszeg, grp...@googlegroups.com
Is it a dynamic load? It could be the time for the service to spin up another instance in order to handle the request?

Robert Engels

unread,
Nov 21, 2018, 11:22:32 AM11/21/18
to Alexandru Keszeg, Alexandru Keszeg, grp...@googlegroups.com
That can easily be a tcp is stall. Just because the client side thinks it sent it doesn’t mean it was actually fully sent and received by the server. 

You could probably use wire shark to know when the data was actually transmitted, or a packet capture on the server as well. 

If you are handling lots of requests it can easily be a network flow condition over the wan. 

to...@spotify.com

unread,
Nov 22, 2018, 8:19:03 AM11/22/18
to grpc.io
5 seconds smells like a DNS timeout. 
I don't know why that would affect issuing an RPC on an already established connection thou. I assume you are not closing the channel between calls?  

Alexandru Keszeg

unread,
Nov 23, 2018, 4:41:28 AM11/23/18
to to...@spotify.com, grp...@googlegroups.com
Monitoring on kube-dns, reports a request rate of only about 2req/s. I've also run tcpdump on the kube-dns pods and I haven't managed to catch any problems. I'm not 100%, but DNS doesn't seem to be an issue. Any way to debug this from grpc-java? Is there any way to log how much time DNS takes? 

According to the ChannelZ service, the connection is closed after the idle timeout (configured to 60 seconds on the client, 5 minutes on the server). keepAliveWithoutCalls is activated and keep alive packets are sent (tested with tcpdump), but the idle configuration and closes the channel. Is it supposed to do this? I would have expected keep alive packet to the connection alive... 


For more options, visit https://groups.google.com/d/optout.

Tommy Ulfsparre

unread,
Nov 23, 2018, 8:37:07 AM11/23/18
to ake...@pitechplus.com, grp...@googlegroups.com
It might be a red herring but there is reported issues of conntrack races causing DNS to timeout with Kubernetes. 

this wouldn't be visible on the kube-dns side but from the container issuing DNS queries. 

DNS resolution would be nice to have visible in traces but I don't think that can be exposed as a ClientInterceptor. 

Alexandru Keszeg

unread,
Nov 23, 2018, 10:37:54 AM11/23/18
to to...@spotify.com, grp...@googlegroups.com
Thank you so much for the links, that is the issue I'm facing right now, it was a DNS issue after all.
Reply all
Reply to author
Forward
0 new messages