gwt-maven-springboot-archetype updated ...
819 views
Skip to first unread message
Frank Hossfeld
Jan 2, 2024, 4:46:30 AMJan 2
to GWT Users
Happy new year!
I just released a new version of the https://github.com/NaluKit/gwt-maven-springboot-archetype. The clean-modular-springboot-webapp generates now a Spring Boot 3 (Java 17) with GWT 2.10.0 multi module project.
Happy coding!
Craig Mitchell
Jan 5, 2024, 8:13:46 PMJan 5
to GWT Users
Thank you! I was struggling to get Springboot to work with GWT, and this did it beautifully!
One thing I messed up:
> Define value for property 'package' teamdrift: : jar
I thought it meant how did I want to package the output, as I need an executable jar, not a war. But it meant what did I want my Java package to be. lol.
One small error, the top level pom.xml has 3 blank lines between every XML line. Just like this: https://github.com/NaluKit/gwt-maven-springboot-archetype/blob/main/clean-modular-springboot-webapp/src/test/resources/projects/basic-webapp/reference/pom.xml Easy to fix up, so only a very minor error.
Thank you for making this awesome tool!
Frank Hossfeld
Jan 6, 2024, 6:36:31 AMJan 6
to GWT Users
The plugin uses the same input (except for the artifactId) as Thomas Broyer's gwt-maven-archetype.
> One small error, the top level pom.xml has 3 blank lines between every XML line. Just like this: https://github.com/NaluKit/gwt-maven-springboot-archetype/blob/main/clean-modular-springboot-webapp/src/test/resources/projects/basic-webapp/reference/pom.xml Easy to fix up, so only a very minor error.
Yeah, that is something annoying. But, no chance to fix it. It seams, it is a bug inside the maven archetype: https://issues.apache.org/jira/browse/ARCHETYPE-584. Think, we have to wait until this one gets fixed.
grays...@gmail.com
Jan 22, 2024, 1:47:52 AMJan 22
to GWT Users
Hi Frank,
Would you please also publish the new version for "modular-springboot-webapp" (the one that generates a gwt project with sample code)? The lastest verison of "modular-springboot-webapp" is still "2022.9.14" which is more than a year old.
Thanks,
Grayson
Frank Hossfeld
Jan 22, 2024, 8:29:41 AMJan 22
to GWT Users
Hi Grayson,
it's on my To-Do-list. I had to wait until GWT 2.11.0 is released. I'll try to take a look today.
cu Frank
Frank Hossfeld
Jan 23, 2024, 7:05:48 AMJan 23
to GWT Users
Hi,
both archetypes have been updated to the latest GWT (2.11.0) & Spring Boot version (3.2.2).
Happy generating ...
Happy generating ...
cu Frank
Craig Mitchell
Jan 24, 2024, 4:39:07 AMJan 24
to GWT Users
I was going to suggest the GWT doco gets updated to use this, but I see you already have! https://www.gwtproject.org/gettingstarted-v2.html
Excellent stuff! 👍
Craig Mitchell
Jan 24, 2024, 4:58:45 AMJan 24
to GWT Users
Ignore my post. Just realised the doco uses net.ltgt.gwt.archetypes and not the springboot com.github.nalukit.archetype.
And thus, it's still on GWT 2.10.0, and not 2.11.0 with the jakarta stuff.
Frank Hossfeld
Jan 24, 2024, 6:35:59 AMJan 24
to GWT Users
Yeap, that's right. Needs an update. May be I'll create a PR ...
At the end of the https://www.gwtproject.org/gettingstarted-v2.html site, you will find a link to the springboot-archetype.
Thomas Broyer
Jan 24, 2024, 1:55:33 PMJan 24
to GWT Users
I updated modular-webapp (and modular-requestfactory) to GWT 2.11 (in version 2024.1.24)
Thomas Broyer
Jan 24, 2024, 1:57:12 PMJan 24
to GWT Users
oh, and GWT 2.11 with Jakarta Servlet and Jetty 11; so requiring at least Java 11.
Frank Hossfeld
Jan 24, 2024, 2:08:27 PMJan 24
to GWT Users
Thanks!
Craig Mitchell
Jan 24, 2024, 6:21:00 PMJan 24
to GWT Users
Awesome stuff! Thank you both. Makes starting a new GWT project a breeze!
Ralph Fiergolla
Jan 25, 2024, 1:55:48 AMJan 25
to google-we...@googlegroups.com
Finally! Thanks a lot!
--
You received this message because you are subscribed to the Google Groups "GWT Users" group.
To unsubscribe from this group and stop receiving emails from it, send an email to google-web-tool...@googlegroups.com.
To view this discussion on the web visit https://groups.google.com/d/msgid/google-web-toolkit/0c06d897-5654-49d8-871a-f10d8ea2d171n%40googlegroups.com.
Craig Mitchell
Jan 31, 2024, 7:00:43 AMJan 31
to GWT Users
Hi,
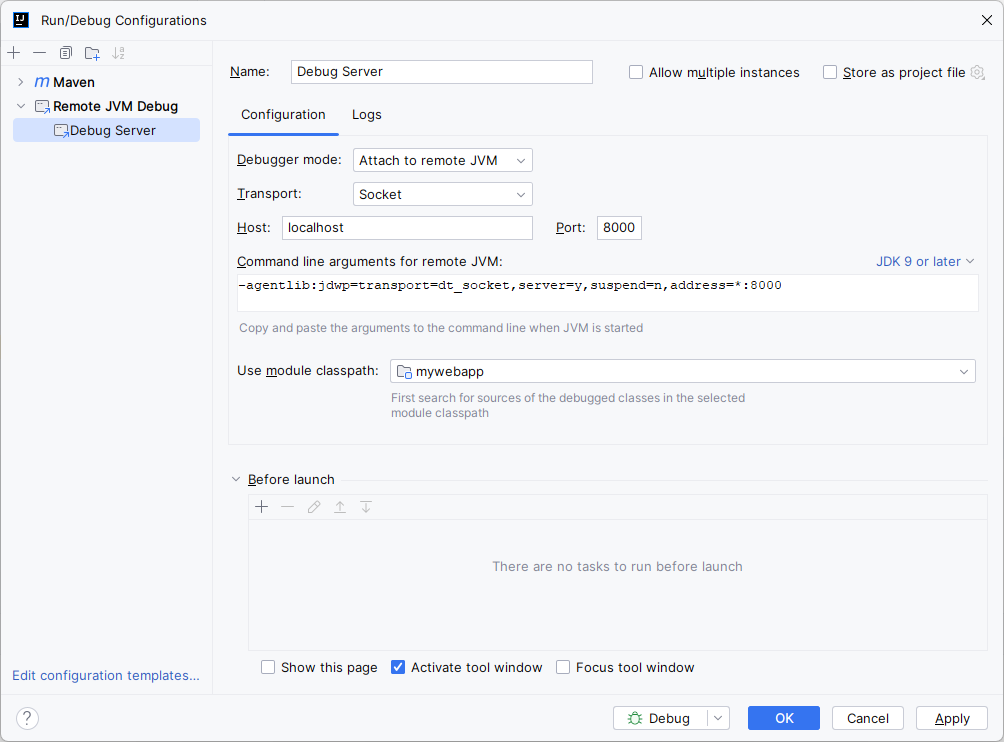
I'm able to debug the GWT client okay (in Chrome). However, debugging the SpringBoot server in IntelliJ isn't working.
I already have the code server running, and then I start the server with:
mvnDebug spring-boot:run -pl mywebapp-server -am
The server then waits for the debugger to attach, so I start up a remote JVM debug in IntelliJ:

And it attaches to the server, which then triggers the server to continue its start.
Everything is now up and running great.
However, putting breakpoints in the server code in IntelliJ, the breakpoints never get hit. Any suggestions as to why?
This might not be a GWT issue, so apologies if it isn't.
Thanks.
Frank Hossfeld
Jan 31, 2024, 8:57:08 AMJan 31
to GWT Users
Hi,
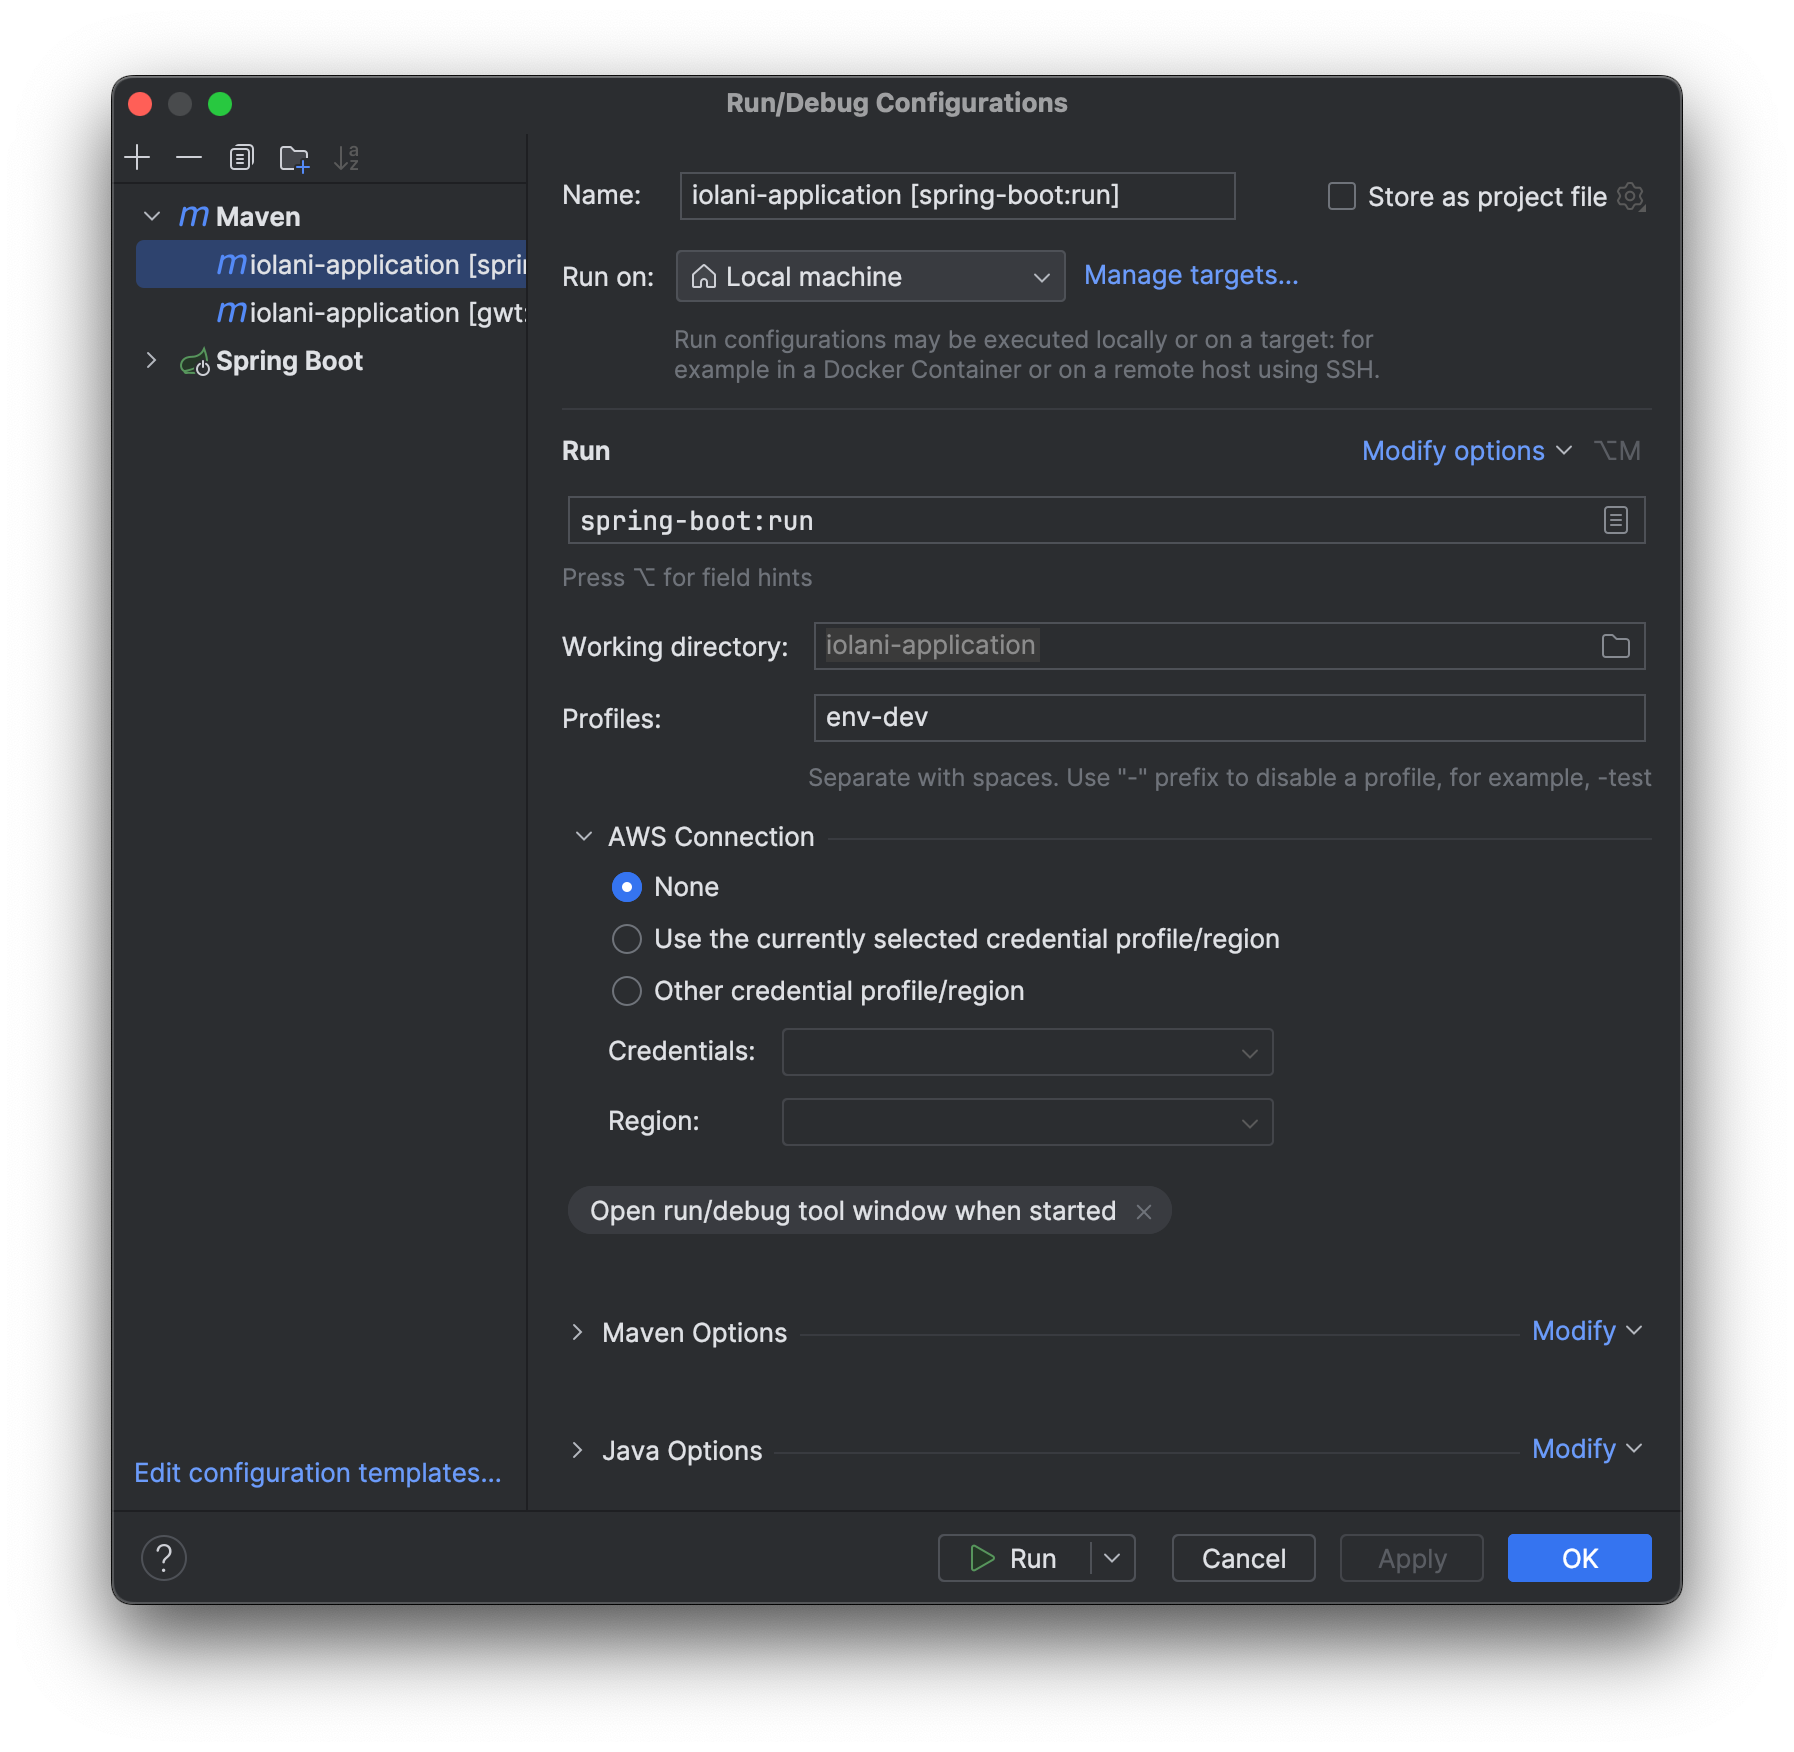
in case using the Ultimate Edition, and have the Spring Developers Plugin installed, just select the Application file and click the green triangle.
in case using the Ultimate Edition, and have the Spring Developers Plugin installed, just select the Application file and click the green triangle.
In both edition creating a Maven run configuration should also work.

bbe...@gmail.com
Jan 31, 2024, 1:12:22 PMJan 31
to GWT Users
The problem is that spring-boot:run is going to launch another Java process for you application, so mvnDebug is attached to the first Maven process, not your application.
You will need to execute spring-boot:run passing the config to enable remote debugging:
mvn spring-boot:run -pl your-project "-Dspring-boot.run.jvmArguments=-Xdebug -Xrunjdwp:transport=dt_socket,server=y,suspend=n,address=8000"
Frank Hossfeld
Jan 31, 2024, 2:35:40 PMJan 31
to GWT Users
Thanks, I am usually using the Spring Boot run configuration from IntelliJ. This works without additional parameters.
Message has been deleted
Frank Hossfeld
Jan 31, 2024, 2:38:47 PMJan 31
to GWT Users
Mmmh, it might be worth adding this information to the archetype docs.
Craig Mitchell
Jan 31, 2024, 4:49:41 PMJan 31
to GWT Users
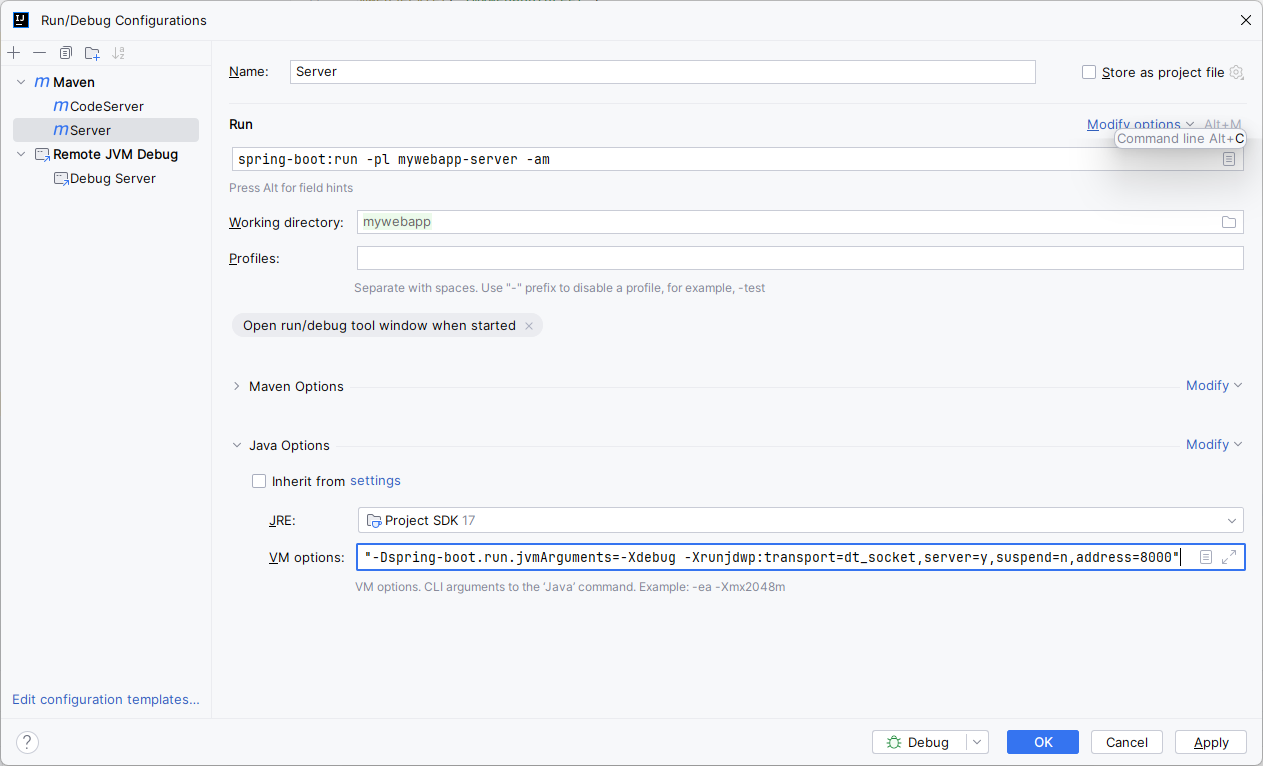
Thank you! Working great now (quotes were important). 👍

Thomas Broyer
Feb 1, 2024, 3:44:19 AMFeb 1
to GWT Users
You may want to use -agentlib:jdwp (as given by IntelliJ IDEA) rather than the legacy -Xdebug -Xrunjdwp (and then you no longer need the quotes 😉)
And when I say legacy, I really mean it: already in Java 8 -Xdebug does nothing (https://docs.oracle.com/javase/8/docs/technotes/tools/unix/java.html#BABHDABI) and Xrunjdwp is superceded by agentlib (https://docs.oracle.com/javase/8/docs/technotes/tools/unix/java.html#BABDCEGG)
Craig Mitchell
Feb 1, 2024, 5:54:46 PMFeb 1
to GWT Users
Thanks Thomas. Now switched to:

-Dspring-boot.run.jvmArguments=-agentlib:jdwp=transport=dt_socket,server=y,suspend=n,address=*:8000

Which also works great. 🙂
Craig Mitchell
Feb 2, 2024, 7:10:34 PMFeb 2
to GWT Users
Just realised you can also set it in your server pom.xml, in the Spring Boot Maven plugin (configuration > jvmArguments), instead of the launcher:
<plugin>
<groupId>org.springframework.boot</groupId>
<artifactId>spring-boot-maven-plugin</artifactId>
<executions>
<execution>
<goals>
<goal>repackage</goal>
</goals>
</execution>
</executions>
<configuration>
<skip>false</skip>
<jvmArguments>
-agentlib:jdwp=transport=dt_socket,server=y,suspend=n,address=*:8000
</jvmArguments>
</configuration>
</plugin>
Craig Mitchell
Feb 3, 2024, 10:57:34 PMFeb 3
to GWT Users
I noticed that it always logs the error:
ERROR: The serialization policy file '/mywebapp/xxx.gwt.rpc' was not found; did you forget to include it in this deployment?
on the first RPC call. The RPC still seems to work fine, but wondering if this is an issue or not?
Also, should this be "gwt-servlet-jakarta", not "gwt-servlet"? https://github.com/NaluKit/gwt-maven-springboot-archetype/blob/main/modular-springboot-webapp/src/test/resources/projects/basic-webapp/reference/basic-webapp-shared/pom.xml#L16
Thanks.
Frank Hossfeld
Feb 4, 2024, 11:59:55 AMFeb 4
to GWT Users
Please can you open an issue regarding the gwt-servlet-jakarta problem ...
Thanks
Craig Mitchell
Feb 4, 2024, 8:13:45 PMFeb 4
to GWT Users
Frank Hossfeld
Feb 6, 2024, 2:11:15 AMFeb 6
to GWT Users
new version is online ...
Frank Hossfeld
Mar 4, 2024, 3:55:58 AMMar 4
to GWT Users
Thanks Craig for contributing. New version is online.
Craig Mitchell
Mar 4, 2024, 6:59:57 AMMar 4
to GWT Users
Thank you Frank for making the excellent tool! Just checked the changes, working perfectly. 🙂
Frank Hossfeld
May 15, 2024, 2:36:10 PMMay 15
to GWT Users
New version available ... This one fixes the serializationPolicyFilePath issue ...
Frank Hossfeld
May 15, 2024, 2:36:52 PMMay 15
to GWT Users
and the version of Spring Bott is updated to 3.2.5
Frank Hossfeld
May 15, 2024, 2:38:52 PMMay 15
to GWT Users
Bott -> Boot ... (spelling correction .... arrrgh)
Craig Mitchell
May 18, 2024, 6:42:09 AMMay 18
to GWT Users
> New version available ... This one fixes the serializationPolicyFilePath issue ...
Awesome, thanks! I've closed https://github.com/NaluKit/gwt-maven-springboot-archetype/issues/7 👍
Craig Mitchell
May 18, 2024, 7:11:40 AMMay 18
to GWT Users
I spoke to soon. Adding the EmbeddedServletContainerConfig fixes the serialization policy when running locally, but if you do a build and try to run. Ie: mvn clean package and then java -jar myserver/myapp.war, it crashes.
I'll investigate. Any ideas/help most welcome.
Frank Hossfeld
May 18, 2024, 9:06:28 AMMay 18
to GWT Users
please can you post the error message: Thanks
Craig Mitchell
May 18, 2024, 10:00:47 AMMay 18
to GWT Users
The issue seems to be the launcherDir directory doesn't exist. I've raised a an issue with the full stack trace: https://github.com/NaluKit/gwt-maven-springboot-archetype/issues/13
Frank Hossfeld
May 18, 2024, 12:17:17 PMMay 18
to GWT Users
I'll added some additional code to avoid adding the launcherDir as document root in production mode.
New version should be soon available.
New version should be soon available.
Craig Mitchell
May 19, 2024, 10:40:45 PMMay 19
to GWT Users
Hi Frank. Unfortunately, that didn't work. I raised an issue: https://github.com/NaluKit/gwt-maven-springboot-archetype/issues/15
I've also submitted a fix: https://github.com/NaluKit/gwt-maven-springboot-archetype/pull/16
However, I couldn't test my fix with the generation. The instructions here: https://github.com/NaluKit/gwt-maven-springboot-archetype?tab=readme-ov-file#local-generation say to test, you do:
cd gwt-maven-springboot-archetype && mvn clean compile
And then I should be able to do:
mvn archetype:generate -DarchetypeGroupId=com.github.nalukit.archetype -DarchetypeVersion=HEAD-SNAPSHOT -DarchetypeArtifactId=modular-springboot-webapp
But that fails with:
The desired archetype does not exist (com:modular-springboot-webapp:HEAD-SNAPSHOT)
I suspect I'm supposed to do a mvn install? Or mvn deploy? Something that makes HEAD-SNAPSHOT available?
Craig Mitchell
May 19, 2024, 11:00:07 PMMay 19
to GWT Users
Just tried a mvn install, and it seems to have worked.
So I think the instructions https://github.com/NaluKit/gwt-maven-springboot-archetype?tab=readme-ov-file#local-generation :
cd gwt-maven-springboot-archetype && mvn clean compile
should be:
cd gwt-maven-springboot-archetype && mvn clean install
And my PR looks good. 🙂
Message has been deleted
Frank Hossfeld
May 20, 2024, 9:07:45 AMMay 20
to GWT Users
Thanks for you PR. Your PR is merged and a new release is done. New version should be available soon.
doing a `mvn clean compile` is usually enough to generate all necessary sources and run the project. It's much faster cause it avoids a GWT compile during build. In case you need a war, run `mvn clean verify`- not sure, if install is really needed. So, for develpment, `mvn clean compile` Is all you need to do. And it save a lot of time especially when the project gets more classes.
doing a `mvn clean compile` is usually enough to generate all necessary sources and run the project. It's much faster cause it avoids a GWT compile during build. In case you need a war, run `mvn clean verify`- not sure, if install is really needed. So, for develpment, `mvn clean compile` Is all you need to do. And it save a lot of time especially when the project gets more classes.
Craig Mitchell
May 21, 2024, 2:13:47 AMMay 21
to GWT Users
Sorry, I think I wasn't clear. Yes, I can make changes to the gwt-maven-springboot-archetype project, and do a mvn compile on it to make sure there are no syntax errors with my changes.
The problem is, if I want to test to make sure my modified version of gwt-maven-springboot-archetype actually generates a new project correctly (Ie: Run mvn archetype:generate ...), this doesn't work unless I do a mvn install. as maven doesn't see the HEAD-SNAPSHOT version, as (I'm guessing a bit here, I'm not a maven expert), I think maven only looks in its repositories (local and remote), and there isn't any HEAD-SNAPSHOT version, as it's not installed. Thus, I get the "The desired archetype does not exist (com:modular-springboot-webapp:HEAD-SNAPSHOT)" error.
fyi: At no point are there any GWT compilations. That comes later when I compile the project that was generated.
Frank Hossfeld
May 21, 2024, 12:02:31 PMMay 21
to GWT Users
Ok, got it, was thinking, we were talking about the generated project ... Yep correct, usually, running the verify goal, will compare the generated sources with the ones stored under test resources. There is no test were the generated project gets started/tested, if it works. The generated project from the verify goal can be found here: 'modular-springboot-webapp/target/test-classes/projects/basic-webapp/project/basic-webapp'
inside the web-app directory you can do a `mvn clean install` and test the project.
Thomas Broyer
May 21, 2024, 12:07:30 PMMay 21
to GWT Users
On Tuesday, May 21, 2024 at 6:02:31 PM UTC+2 frank.h...@googlemail.com wrote:
Ok, got it, was thinking, we were talking about the generated project ... Yep correct, usually, running the verify goal, will compare the generated sources with the ones stored under test resources. There is no test were the generated project gets started/tested, if it works.
Out of curiosity, any specific reason you don't automate a "mvn clean verify" to validate the generated project?
(of course testing that devmode works, or that the built artifact actually works is trickier and probably not worth it, but a simple build would still be better than nothing IMO)
Craig Mitchell
May 21, 2024, 9:48:18 PMMay 21
to GWT Users
Thanks Frank. I was misunderstanding and didn't know about the basic-webapp in the target.
I revamped the readme.md: https://github.com/NaluKit/gwt-maven-springboot-archetype/pull/17
Hopefully made it better not worse. 😆
Frank Hossfeld
May 23, 2024, 12:31:18 PMMay 23
to GWT Users
Running a `mvn clean verify` generate the project and compares it with predefined sources. Similar to your gwt-maven-archetype.
What not gets tested, is building a war and run it.
What not gets tested, is building a war and run it.
Frank Hossfeld
May 23, 2024, 12:32:12 PMMay 23
to GWT Users
Thanks for contributing, Craig, LGTM, so already merged. :-)
Craig Mitchell
May 23, 2024, 7:47:30 PMMay 23
to GWT Users
When Thomas said:
I suspect he was talking about a Git pre-push hook that automatically did a mvn verify: https://git-scm.com/docs/githooks#_pre_push Unless I misunderstood.
Thomas Broyer
May 24, 2024, 5:22:43 AMMay 24
to GWT Users
On Thursday, May 23, 2024 at 6:31:18 PM UTC+2 frank.h...@googlemail.com wrote:
Running a `mvn clean verify` generate the project and compares it with predefined sources. Similar to your gwt-maven-archetype.
What not gets tested, is building a war and run it.
Ah, apparently it also gets built (https://github.com/NaluKit/gwt-maven-springboot-archetype/blob/main/modular-springboot-webapp/src/test/resources/projects/basic-webapp/goal.txt), but indeed the generated WAR is not run.
👍
(fwiw, your GitHub Actions workflow no longer runs as it targets the master branch and you renamed it to main)
Frank Hossfeld
May 25, 2024, 11:37:58 AMMay 25
to GWT Users
> (fwiw, your GitHub Actions workflow no longer runs as it targets the master branch and you renamed it to main)
good point! Thanks.
Reply all
Reply to author
Forward
0 new messages
