Issue Displaying All (Column) Chart Values
11 views
Skip to first unread message

Ian Boynton
Aug 10, 2017, 4:34:29 PM8/10/17
to Google Visualization API
Hi -
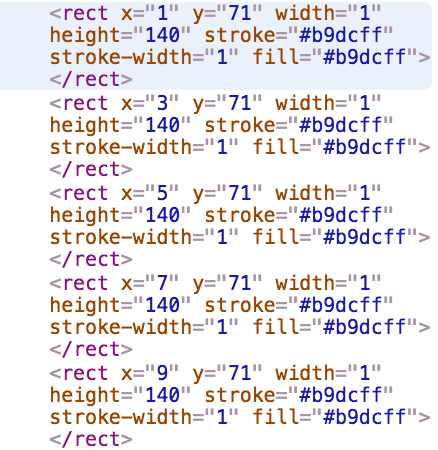
I am constructing a column chart that contains 300+ data points to draw, and am having issues with scaling the chart so that it fits within its' parent div. I've used the bar.groupWidth property to set the column width to 1px, but this has not fully resolved my issue, as the columns seem to be drawn 2 pixels apart (see attached image showing the x values of the column charts).
Is there a way for me to manually force the columns to be drawn incrementally, without this double step?
Or, are there better ways for me to force a Column Chart to be restricted to a certain width?
Thanks in advance for any help!
Best,
Ian

Daniel LaLiberte
Aug 10, 2017, 5:11:21 PM8/10/17
to Google Visualization API
There are a couple more undocumented options you can experiment with to try to get the output you want.
bar: {
width: number | percentString,
gap: number,
group: {
width: number | percentString,
gap: number
}
}
bar.groupWidth ought to be the same as bar.group.width if everything is implemented correctly.
Hope that helps.
--
You received this message because you are subscribed to the Google Groups "Google Visualization API" group.
To unsubscribe from this group and stop receiving emails from it, send an email to google-visualization-api+unsub...@googlegroups.com.
To post to this group, send email to google-visualization-api@googlegroups.com.
Visit this group at https://groups.google.com/group/google-visualization-api.
To view this discussion on the web visit https://groups.google.com/d/msgid/google-visualization-api/f1a1adec-3b95-4869-a6a4-a6bc300e6777%40googlegroups.com.
For more options, visit https://groups.google.com/d/optout.
Reply all
Reply to author
Forward
0 new messages