How can I show gap in line even when interpolateNulls is set to true
18 views
Skip to first unread message

Gurjit Singh
Feb 13, 2019, 2:26:08 AM2/13/19
to Google Visualization API
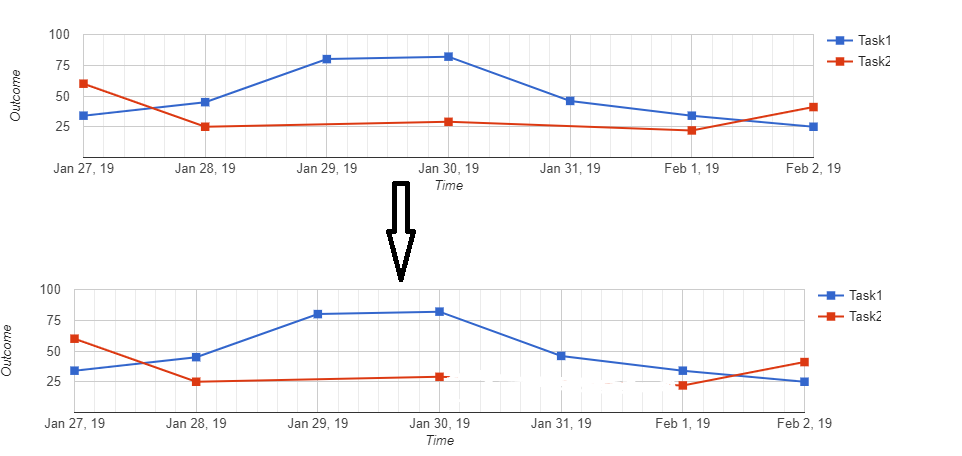
Hi, I have a situation in Line chart in which I need to skip and connect data point for nulls,
But same time I need to show gap for null points. how can I achieve
Here is my fiddle example
I want to achieve something this


Daniel LaLiberte
Feb 13, 2019, 7:13:59 AM2/13/19
to Google Visualization API
If you need interpolateNulls to be true, then I believe your only alternative is to use the 'style' role to make the color of the points and lines be none.
--
You received this message because you are subscribed to the Google Groups "Google Visualization API" group.
To unsubscribe from this group and stop receiving emails from it, send an email to google-visualizati...@googlegroups.com.
To post to this group, send email to google-visua...@googlegroups.com.
Visit this group at https://groups.google.com/group/google-visualization-api.
To view this discussion on the web visit https://groups.google.com/d/msgid/google-visualization-api/246c2b92-0807-4632-982d-ce2a7bd39322%40googlegroups.com.
For more options, visit https://groups.google.com/d/optout.
dlaliberte@Google.com Cambridge MA
Gurjit Singh
Feb 13, 2019, 7:44:50 AM2/13/19
to Google Visualization API
Thanks for the quick response.
Now datapoint is also disappearing.
On Wednesday, February 13, 2019 at 5:43:59 PM UTC+5:30, Daniel LaLiberte wrote:
If you need interpolateNulls to be true, then I believe your only alternative is to use the 'style' role to make the color of the points and lines be none.
On Wed, Feb 13, 2019 at 2:26 AM Gurjit Singh <gurjit...@onebcg.com> wrote:
Hi, I have a situation in Line chart in which I need to skip and connect data point for nulls,--But same time I need to show gap for null points. how can I achieveHere is my fiddle exampleI want to achieve something this
You received this message because you are subscribed to the Google Groups "Google Visualization API" group.
To unsubscribe from this group and stop receiving emails from it, send an email to google-visualization-api+unsub...@googlegroups.com.
To post to this group, send email to google-visua...@googlegroups.com.
Visit this group at https://groups.google.com/group/google-visualization-api.
To view this discussion on the web visit https://groups.google.com/d/msgid/google-visualization-api/246c2b92-0807-4632-982d-ce2a7bd39322%40googlegroups.com.
For more options, visit https://groups.google.com/d/optout.
--dlali...@Google.com Cambridge MA
Gurjit Singh
Feb 13, 2019, 11:02:48 PM2/13/19
to Google Visualization API
Daniel LaLiberte
Feb 14, 2019, 1:43:50 AM2/14/19
to Google Visualization API
Cool. Or you could use stroke-color instead of color. But I think what you did is better.
On Wed, Feb 13, 2019 at 11:02 PM Gurjit Singh <gurjit...@onebcg.com> wrote:
I achieved
https://jsfiddle.net/0b2769eh/
Thanks.
On Wednesday, February 13, 2019 at 6:14:50 PM UTC+5:30, Gurjit Singh wrote:
Thanks for the quick response.Now datapoint is also disappearing.
On Wednesday, February 13, 2019 at 5:43:59 PM UTC+5:30, Daniel LaLiberte wrote:
If you need interpolateNulls to be true, then I believe your only alternative is to use the 'style' role to make the color of the points and lines be none.
On Wed, Feb 13, 2019 at 2:26 AM Gurjit Singh <gurjit...@onebcg.com> wrote:
Hi, I have a situation in Line chart in which I need to skip and connect data point for nulls,--But same time I need to show gap for null points. how can I achieveHere is my fiddle exampleI want to achieve something this
You received this message because you are subscribed to the Google Groups "Google Visualization API" group.
To unsubscribe from this group and stop receiving emails from it, send an email to google-visualizati...@googlegroups.com.
To post to this group, send email to google-visua...@googlegroups.com.
Visit this group at https://groups.google.com/group/google-visualization-api.
To view this discussion on the web visit https://groups.google.com/d/msgid/google-visualization-api/246c2b92-0807-4632-982d-ce2a7bd39322%40googlegroups.com.
For more options, visit https://groups.google.com/d/optout.
--dlali...@Google.com Cambridge MA
--
You received this message because you are subscribed to the Google Groups "Google Visualization API" group.
To unsubscribe from this group and stop receiving emails from it, send an email to google-visualizati...@googlegroups.com.
To post to this group, send email to google-visua...@googlegroups.com.
Visit this group at https://groups.google.com/group/google-visualization-api.
To view this discussion on the web visit https://groups.google.com/d/msgid/google-visualization-api/f0700949-18ce-4126-944d-8a8d9c5356e2%40googlegroups.com.
For more options, visit https://groups.google.com/d/optout.
dlaliberte@Google.com Cambridge MA
Gurjit Singh
Feb 14, 2019, 2:02:06 AM2/14/19
to google-visua...@googlegroups.com
Great!
Thank you.
Thank you.
To view this discussion on the web visit https://groups.google.com/d/msgid/google-visualization-api/CAOtcSJPQGhXFtzEkXqSc87KXcSULrrFE4ORPEeBWcwPFdWYRVA%40mail.gmail.com.
Reply all
Reply to author
Forward
0 new messages