timeofday does not start at 0
50 views
Skip to first unread message

Domh4445
Feb 12, 2018, 11:56:16 AM2/12/18
to Google Visualization API
Hello
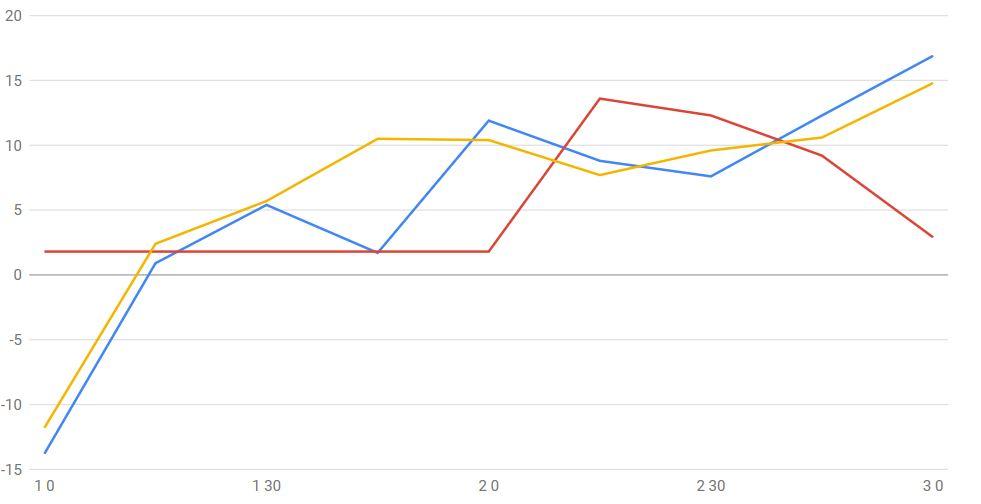
IWith the following script, I would expect the hAxis starting at "0" but it starts at "1" ( see the picture attached)..
Any idea what's wrong ?
Thanks in advance
<script type="text/javascript" src="https://www.gstatic.com/charts/loader.js"></script>
<script type="text/javascript">
google.charts.load('current', {'packages':['line']});
google.charts.setOnLoadCallback(drawChart);
function drawChart() {
var data = new google.visualization.DataTable();
data.addColumn('timeofday', 'Heure');
data.addColumn('number', 'Hier');
data.addColumn('number', 'Aujourd hui');
data.addColumn('number', 'Avant hier');
data.addRows([
[[0, 0, 0],-13.8, 1.8,-11.8],
[[0 ,15, 0], 0.9, 1.8, 2.4],
[[0,30, 0], 5.4, 1.8, 5.7],
[[0, 45, 0], 1.7, 1.8, 10.5],
[[1, 0, 0], 11.9, 1.8, 10.4],
[[1, 15, 0], 8.8, 13.6, 7.7],
[[1, 30, 0], 7.6, 12.3, 9.6],
[[1, 45, 0], 12.3, 9.2, 10.6],
[[2, 0, 0], 16.9, 2.9, 14.8]
]);
var options = {
chart: {
title: 'Temperature Chevry Ext',
subtitle: 'mesure chaque quart d heure'
},
width: 900,
height: 500,
hAxis: {
title: 'heures' , format: 'H m'
}
};
var chart = new google.charts.Line(document.getElementById('line_top_x'));
chart.draw(data, google.charts.Line.convertOptions(options));
}
</script>

Daniel LaLiberte
Feb 12, 2018, 12:09:14 PM2/12/18
to Google Visualization API
Could you try the 'upcoming' version rather than 'current'? There are lots of changes regarding the display of axis ticks that might help in this case.
--
You received this message because you are subscribed to the Google Groups "Google Visualization API" group.
To unsubscribe from this group and stop receiving emails from it, send an email to google-visualization-api+unsub...@googlegroups.com.
To post to this group, send email to google-visualization-api@googlegroups.com.
Visit this group at https://groups.google.com/group/google-visualization-api.
To view this discussion on the web visit https://groups.google.com/d/msgid/google-visualization-api/e7a40ca1-99ce-49dc-b41a-f884b66bc605%40googlegroups.com.
For more options, visit https://groups.google.com/d/optout.
Domh4445
Feb 13, 2018, 1:58:28 AM2/13/18
to Google Visualization API
Hello
I get the same result with 'upcoming'
The only change I did is on that line: google.charts.load('upcoming', {'packages':['line']});
Thanks
Le lundi 12 février 2018 17:56:16 UTC+1, Domh4445 a écrit :
Hello
Domh4445
Feb 13, 2018, 3:16:52 AM2/13/18
to Google Visualization API
more .....
with this it starts a "1"
with this it starts a "1"
[[0, 0, 0],-13.8, 1.8,-11.8],
[[0 ,15, 0], 0.9, 1.8, 2.4],
[[0,30, 0], 5.4, 1.8, 5.7],
[[0, 45, 0], 1.7, 1.8, 10.5],
[[1, 0, 0], 11.9, 1.8, 10.4],
[[1, 15, 0], 8.8, 13.6, 7.7],
[[1, 30, 0], 7.6, 12.3, 9.6],
[[1, 45, 0], 12.3, 9.2, 10.6],
[[2, 0, 0], 16.9, 2.9, 14.8]
but with this, it start at "9"
[[8, 0, 0],-13.8, 1.8,-11.8],
[[8 ,15, 0], 0.9, 1.8, 2.4],
[[8,30, 0], 5.4, 1.8, 5.7],
[[8, 45, 0], 1.7, 1.8, 10.5],
[[9, 0, 0], 11.9, 1.8, 10.4],
[[9, 15, 0], 8.8, 13.6, 7.7],
[[9, 30, 0], 7.6, 12.3, 9.6],
[[9, 45, 0], 12.3, 9.2, 10.6],
[[10, 0, 0], 16.9, 2.9, 14.8]
[[8, 0, 0],-13.8, 1.8,-11.8],
[[8 ,15, 0], 0.9, 1.8, 2.4],
[[8,30, 0], 5.4, 1.8, 5.7],
[[8, 45, 0], 1.7, 1.8, 10.5],
[[9, 0, 0], 11.9, 1.8, 10.4],
[[9, 15, 0], 8.8, 13.6, 7.7],
[[9, 30, 0], 7.6, 12.3, 9.6],
[[9, 45, 0], 12.3, 9.2, 10.6],
[[10, 0, 0], 16.9, 2.9, 14.8]
Le lundi 12 février 2018 17:56:16 UTC+1, Domh4445 a écrit :
Daniel LaLiberte
Feb 13, 2018, 2:05:22 PM2/13/18
to Google Visualization API
Could it be a timezone issue? If so, that's pretty bad.
Could you try a few of the older versions? 41, 42, 43, and 44 are available.
--
You received this message because you are subscribed to the Google Groups "Google Visualization API" group.
To unsubscribe from this group and stop receiving emails from it, send an email to google-visualization-api+unsub...@googlegroups.com.
To post to this group, send email to google-visualization-api@googlegroups.com.
Visit this group at https://groups.google.com/group/google-visualization-api.
To view this discussion on the web visit https://groups.google.com/d/msgid/google-visualization-api/b968fc1d-bebd-4f8c-acc0-5e1c072961ce%40googlegroups.com.
Domh4445
Feb 14, 2018, 6:07:26 AM2/14/18
to Google Visualization API
Hi Daniel
It is ok with 41 42 and 43. It is broken from 44
Thanks
To post to this group, send email to google-visua...@googlegroups.com.
To view this discussion on the web visit https://groups.google.com/d/msgid/google-visualization-api/b968fc1d-bebd-4f8c-acc0-5e1c072961ce%40googlegroups.com.
Daniel LaLiberte
Feb 14, 2018, 11:06:12 AM2/14/18
to Google Visualization API
Good to know. That should help narrow it down.
To unsubscribe from this group and stop receiving emails from it, send an email to google-visualization-api+unsubscr...@googlegroups.com.
To post to this group, send email to google-visua...@googlegroups.com.
Visit this group at https://groups.google.com/group/google-visualization-api.
To view this discussion on the web visit https://groups.google.com/d/msgid/google-visualization-api/b968fc1d-bebd-4f8c-acc0-5e1c072961ce%40googlegroups.com.
--
You received this message because you are subscribed to the Google Groups "Google Visualization API" group.
To unsubscribe from this group and stop receiving emails from it, send an email to google-visualization-api+unsub...@googlegroups.com.
To post to this group, send email to google-visualization-api@googlegroups.com.
Visit this group at https://groups.google.com/group/google-visualization-api.
To view this discussion on the web visit https://groups.google.com/d/msgid/google-visualization-api/eff98eef-2a4b-4608-85d7-1211fab885d9%40googlegroups.com.

Gregg Somes
Feb 14, 2018, 11:10:29 AM2/14/18
to google-visua...@googlegroups.com
Did you try starting it with [-1,0,0], ...
--
You received this message because you are subscribed to the Google Groups "Google Visualization API" group.
To unsubscribe from this group and stop receiving emails from it, send an email to google-visualization-api+unsub...@googlegroups.com.
To post to this group, send email to google-visualization-api@googlegroups.com.
Visit this group at https://groups.google.com/group/google-visualization-api.
Domh4445
Feb 14, 2018, 11:39:45 AM2/14/18
to Google Visualization API
Yes with [-1,0,0], it starts at 0
...
Le lundi 12 février 2018 17:56:16 UTC+1, Domh4445 a écrit :
Domh4445
Feb 27, 2018, 5:34:00 AM2/27/18
to Google Visualization API
Hello
Do you know on which release, it will be fixed ?
Thanks
Le lundi 12 février 2018 17:56:16 UTC+1, Domh4445 a écrit :
Daniel LaLiberte
Feb 27, 2018, 8:13:52 AM2/27/18
to Google Visualization API
I didn't notice this before, but the problem is that the material chart (google.charts.Line) doesn't deal with the timeofday value properly. The classic charts do behave properly, however, and I'm not sure how the recent versions broke timeofday for the material charts, but we may not bother fixing it. I expect the plan going forward will be to fold the few new features provided by the material charts back into the classic charts. There is a theme: 'material' option to make the classic charts have the fonts and colors of the material version.
--
You received this message because you are subscribed to the Google Groups "Google Visualization API" group.
To unsubscribe from this group and stop receiving emails from it, send an email to google-visualization-api+unsub...@googlegroups.com.
To post to this group, send email to google-visualization-api@googlegroups.com.
Visit this group at https://groups.google.com/group/google-visualization-api.
To view this discussion on the web visit https://groups.google.com/d/msgid/google-visualization-api/f7215cc4-a4cc-43c0-b1e6-1d7196116ec3%40googlegroups.com.
Reply all
Reply to author
Forward
0 new messages