issue regarding annotated timeline chart
31 views
Skip to first unread message

ashish mokadam
Sep 12, 2018, 2:07:20 AM9/12/18
to Google Visualization API
Hi
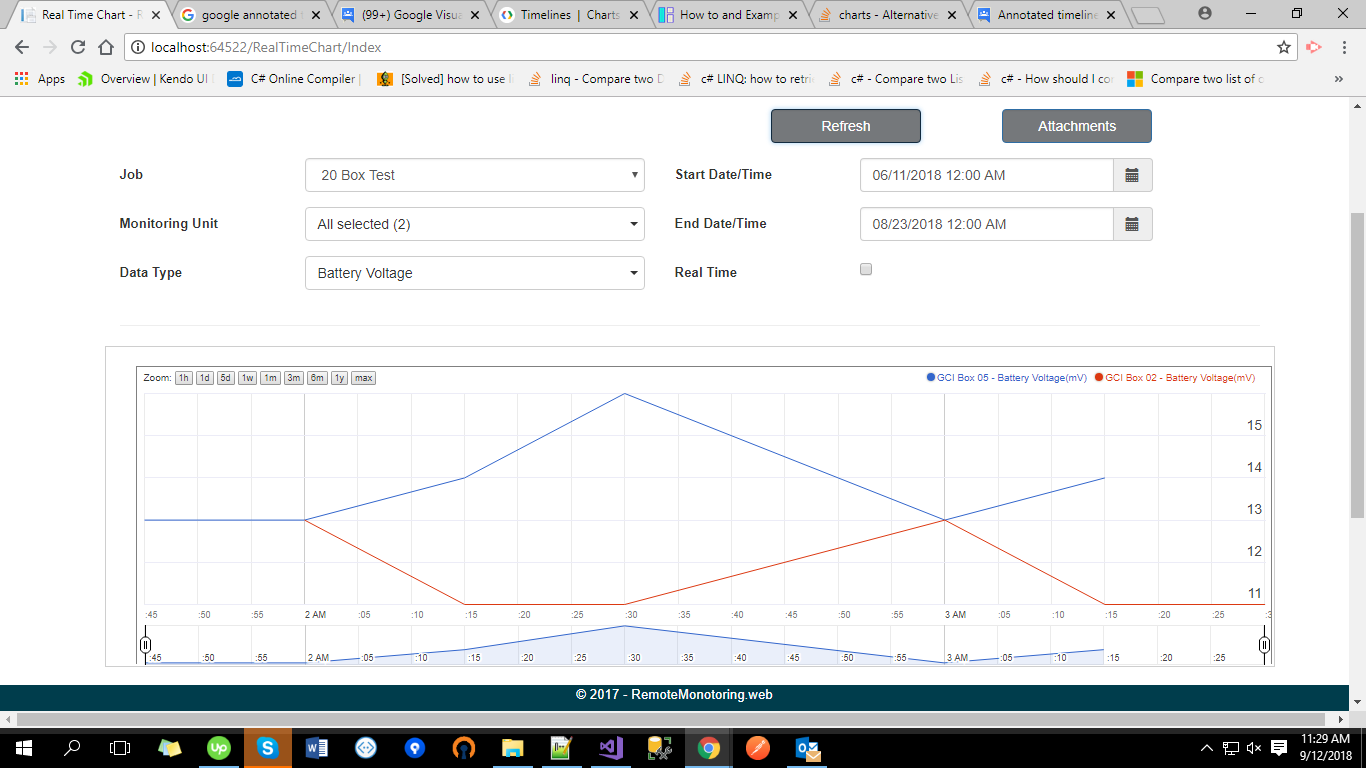
I am using google annotated timeline chart to display some data. When data is less I could see the desired output, all the timelines are perfect . But In my case data is 400,000 + and it will keep on increasing. So my query is when i try to plot with such a huge data i only see points or dots instead of proper timeline. How to fix it ?
Since i am unable to understand what needs to be done to fix it.
here is my code
function drawChart() {
debugger;
var chart = new google.visualization.AnnotatedTimeLine(document.getElementById('chart_div'));
if (jsonObj != "-1") {
if (jsonObj.length <= 0) {
$('#Divbox').hide();
$('#chart_div').text('No Data Available.');
//to disble download button
// $('#btnDownload').prop('disabled', true);
}
else {
//to enable download button
//$('#btnDownload').prop('disabled', false);
var arr = new Array(jsonObj.length);
for (var i = 0; i < jsonObj.length; i++) {
arr[i] = new Array(jsonObj[i].length);
for (var j = 0; j < jsonObj[i].length; j++) {
if (j == 0) {
arr[i][j] = jsonObj[i][j];
}
else {
if (jsonObj[i][j] == "") {
arr[i][j] = null;
}
else {
arr[i][j] = parseInt(jsonObj[i][j]);
}
}
}
}
var list = "@Html.Raw(ViewBag.datatypesNames)";
var arrlist = list.split(",");
var data = new google.visualization.DataTable();
data.addColumn('date', 'SensorValueDate');
for (var j = 0; j < arrlist.length; j++) {
data.addColumn('number', arrlist[j]);
}
//data.addColumn('string', 'Unitname');
debugger;
for (var index = 0; index < arr.length; index++) {
debugger;
arr[index][0] = new Date(arr[index][0]);
}
data.addRows(arr);
//chart.draw(data, { displayAnnotations: true });
window.setTimeout(function () {
try { chart.draw(data, { displayAnnotations: true }); } catch (err) {
console.err(err);
}
}, 1000);
}
}
Your help would be highly appreciated.
Thanks

Daniel LaLiberte
Sep 12, 2018, 9:27:55 AM9/12/18
to Google Visualization API
Could you provide some actual data that demonstrates the problem you are seeing?
If you could create a jsfiddle, or point to a web page, that would be even better.
--
You received this message because you are subscribed to the Google Groups "Google Visualization API" group.
To unsubscribe from this group and stop receiving emails from it, send an email to google-visualizati...@googlegroups.com.
To post to this group, send email to google-visua...@googlegroups.com.
Visit this group at https://groups.google.com/group/google-visualization-api.
To view this discussion on the web visit https://groups.google.com/d/msgid/google-visualization-api/ee312106-9595-48c7-9879-5d79a63433d1%40googlegroups.com.
For more options, visit https://groups.google.com/d/optout.
ashish mokadam
Sep 13, 2018, 9:34:39 AM9/13/18
to Google Visualization API
Hi Daniel.
Thanks for reply.
Actually. I found the issue myself due to which it was simply showing dots instead of Timeline.
The issue was with data. There is a field of type integer in the database which has int values as well Nulls too. So if you pass NULL to the chart surely it will break and it won't connect the points and will not form timeline.
So the solution is before passing data to the chart with NULL values just check whether you have NULL's . Where ever you find NULL just replace it with '0'.
Reply all
Reply to author
Forward
0 new messages