I'm getting error with the tooltip when redraw DualY Chart.
36 views
Skip to first unread message

Kha Nguyen Dong
Nov 17, 2015, 3:30:58 AM11/17/15
to Google Visualization API
I'm developing statistic app using MVC. I click Submit to draw chart in the first time and hover on it's column.
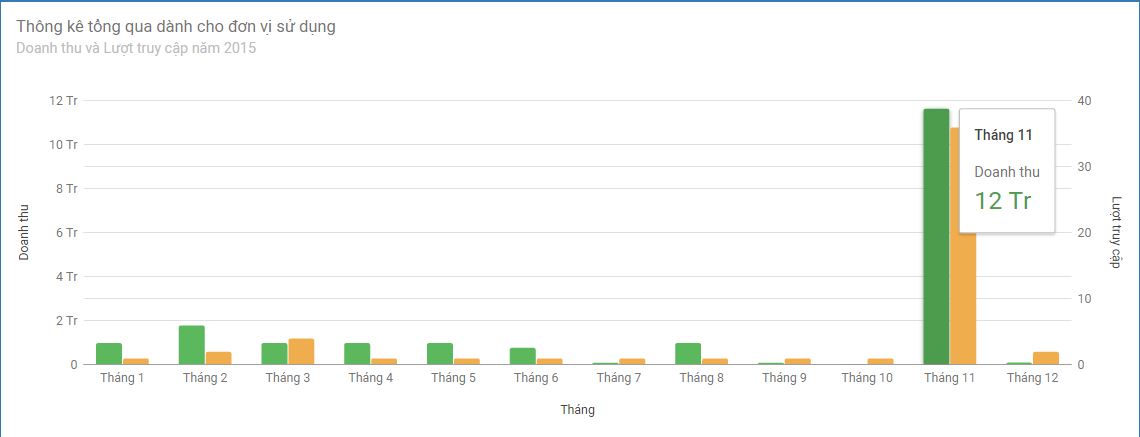
But when I click Submit again redraw the chart, I hover the column and it disappear, and it's tooltip seem like error.

Can someone show me the solution to solve this problem?

Sergey Grabkovsky
Nov 17, 2015, 9:39:13 AM11/17/15
to Google Visualization API
Hi Kha,
It's hard to say what's going on without any code that reproduces the issue. My guess is that either there is a better way to redraw the chart than what you're currently doing, or that the issue is fixed in version 43.
--
You received this message because you are subscribed to the Google Groups "Google Visualization API" group.
To unsubscribe from this group and stop receiving emails from it, send an email to google-visualizati...@googlegroups.com.
To post to this group, send email to google-visua...@googlegroups.com.
Visit this group at http://groups.google.com/group/google-visualization-api.
To view this discussion on the web visit https://groups.google.com/d/msgid/google-visualization-api/f0ac1391-8d6a-4f62-980a-310ed59e7909%40googlegroups.com.
For more options, visit https://groups.google.com/d/optout.
--

Sergey Grabkovsky | SWE | gra...@google.com
Kha Nguyen Dong
Nov 17, 2015, 8:26:58 PM11/17/15
to Google Visualization API
Thanks Sergey,
I stored the code to draw chart and statistic's template in a PartialView. I use ajax to load the PartialView and insert it in a DIV. When i click submit again, I empty the DIV add insert the view into it again.
the problem only happen when I draw chart => hover the column => redrawn => hover the column again.
I think the chart need to be destroyed before I redrawn the new chart.
Hope you can help me.
Here is my code:

Hi Kha,It's hard to say what's going on without any code that reproduces the issue. My guess is that either there is a better way to redraw the chart than what you're currently doing, or that the issue is fixed in version 43.
On Tue, Nov 17, 2015 at 3:31 AM Kha Nguyen Dong <dongk...@gmail.com> wrote:
I'm developing statistic app using MVC. I click Submit to draw chart in the first time and hover on it's column.--
But when I click Submit again redraw the chart, I hover the column and it disappear, and it's tooltip seem like error.
Can someone show me the solution to solve this problem?
You received this message because you are subscribed to the Google Groups "Google Visualization API" group.
To unsubscribe from this group and stop receiving emails from it, send an email to google-visualization-api+unsub...@googlegroups.com.
To post to this group, send email to google-visua...@googlegroups.com.
Visit this group at http://groups.google.com/group/google-visualization-api.
To view this discussion on the web visit https://groups.google.com/d/msgid/google-visualization-api/f0ac1391-8d6a-4f62-980a-310ed59e7909%40googlegroups.com.
For more options, visit https://groups.google.com/d/optout.
Sergey Grabkovsky
Nov 18, 2015, 9:39:23 AM11/18/15
to Google Visualization API
I can't use your code when it's as a screenshot, please attach a text file. The code you screenshotted also doesn't appear to contain the part that you said actually causes the error, which is the chart redrawing. However, if that's your method for redrawing the chart, then the issue is that you create a new instance of the chart every time you redraw, where you should reuse the previous instance.
On Tue, Nov 17, 2015 at 8:27 PM Kha Nguyen Dong <dongk...@gmail.com> wrote:
Thanks Sergey,I stored the code to draw chart and statistic's template in a PartialView. I use ajax to load the PartialView and insert it in a DIV. When i click submit again, I empty the DIV add insert the view into it again.the problem only happen when I draw chart => hover the column => redrawn => hover the column again.I think the chart need to be destroyed before I redrawn the new chart.Hope you can help me.Here is my code:
On Tuesday, November 17, 2015 at 9:39:13 PM UTC+7, Sergey wrote:Hi Kha,It's hard to say what's going on without any code that reproduces the issue. My guess is that either there is a better way to redraw the chart than what you're currently doing, or that the issue is fixed in version 43.On Tue, Nov 17, 2015 at 3:31 AM Kha Nguyen Dong <dongk...@gmail.com> wrote:
I'm developing statistic app using MVC. I click Submit to draw chart in the first time and hover on it's column.--
But when I click Submit again redraw the chart, I hover the column and it disappear, and it's tooltip seem like error.
Can someone show me the solution to solve this problem?
You received this message because you are subscribed to the Google Groups "Google Visualization API" group.
To unsubscribe from this group and stop receiving emails from it, send an email to google-visualizati...@googlegroups.com.
To post to this group, send email to google-visua...@googlegroups.com.
Visit this group at http://groups.google.com/group/google-visualization-api.
To view this discussion on the web visit https://groups.google.com/d/msgid/google-visualization-api/f0ac1391-8d6a-4f62-980a-310ed59e7909%40googlegroups.com.
For more options, visit https://groups.google.com/d/optout.
--![unnamed.gif]() Sergey Grabkovsky | SWE | gra...@google.com
Sergey Grabkovsky | SWE | gra...@google.com
--
You received this message because you are subscribed to the Google Groups "Google Visualization API" group.
To unsubscribe from this group and stop receiving emails from it, send an email to google-visualizati...@googlegroups.com.
To post to this group, send email to google-visua...@googlegroups.com.
Visit this group at http://groups.google.com/group/google-visualization-api.
To view this discussion on the web visit https://groups.google.com/d/msgid/google-visualization-api/9518415b-c9cd-4988-b2b1-b5a1c2cd1c8f%40googlegroups.com.
For more options, visit https://groups.google.com/d/optout.
Kha Nguyen Dong
Nov 19, 2015, 3:51:47 AM11/19/15
to Google Visualization API
Hi Sergey,
Here is my small demo. Please test it and give me some idea to solve this problem. Tks a lot!
Here is my small demo. Please test it and give me some idea to solve this problem. Tks a lot!
On Wednesday, November 18, 2015 at 9:39:23 PM UTC+7, Sergey wrote:
I can't use your code when it's as a screenshot, please attach a text file. The code you screenshotted also doesn't appear to contain the part that you said actually causes the error, which is the chart redrawing. However, if that's your method for redrawing the chart, then the issue is that you create a new instance of the chart every time you redraw, where you should reuse the previous instance.
On Tue, Nov 17, 2015 at 8:27 PM Kha Nguyen Dong <dongk...@gmail.com> wrote:
Thanks Sergey,I stored the code to draw chart and statistic's template in a PartialView. I use ajax to load the PartialView and insert it in a DIV. When i click submit again, I empty the DIV add insert the view into it again.the problem only happen when I draw chart => hover the column => redrawn => hover the column again.I think the chart need to be destroyed before I redrawn the new chart.Hope you can help me.Here is my code:
On Tuesday, November 17, 2015 at 9:39:13 PM UTC+7, Sergey wrote:Hi Kha,It's hard to say what's going on without any code that reproduces the issue. My guess is that either there is a better way to redraw the chart than what you're currently doing, or that the issue is fixed in version 43.On Tue, Nov 17, 2015 at 3:31 AM Kha Nguyen Dong <dongk...@gmail.com> wrote:
I'm developing statistic app using MVC. I click Submit to draw chart in the first time and hover on it's column.--
But when I click Submit again redraw the chart, I hover the column and it disappear, and it's tooltip seem like error.
Can someone show me the solution to solve this problem?
You received this message because you are subscribed to the Google Groups "Google Visualization API" group.
To unsubscribe from this group and stop receiving emails from it, send an email to google-visualization-api+unsub...@googlegroups.com.
To post to this group, send email to google-visua...@googlegroups.com.
Visit this group at http://groups.google.com/group/google-visualization-api.
To view this discussion on the web visit https://groups.google.com/d/msgid/google-visualization-api/f0ac1391-8d6a-4f62-980a-310ed59e7909%40googlegroups.com.
For more options, visit https://groups.google.com/d/optout.
----![unnamed.gif]() Sergey Grabkovsky | SWE | gra...@google.com
Sergey Grabkovsky | SWE | gra...@google.com
You received this message because you are subscribed to the Google Groups "Google Visualization API" group.
To unsubscribe from this group and stop receiving emails from it, send an email to google-visualization-api+unsub...@googlegroups.com.
To post to this group, send email to google-visua...@googlegroups.com.
Visit this group at http://groups.google.com/group/google-visualization-api.
To view this discussion on the web visit https://groups.google.com/d/msgid/google-visualization-api/9518415b-c9cd-4988-b2b1-b5a1c2cd1c8f%40googlegroups.com.
For more options, visit https://groups.google.com/d/optout.
Sergey Grabkovsky
Nov 19, 2015, 9:47:07 AM11/19/15
to Google Visualization API
Hi Kha,
I don't have a Windows machine immediately available, nor do I have Visual Studio installed on the Windows machines I do have. So I wouldn't be able to run your app if I wanted to.
This is the kind of example I meant. If you can modify that example to reproduce the issue you're experiencing, I can tell you whether it's a bug or user error.
On Thu, Nov 19, 2015 at 3:51 AM Kha Nguyen Dong <dongk...@gmail.com> wrote:
Hi Sergey,
Here is my small demo. Please test it and give me some idea to solve this problem. Tks a lot!
On Wednesday, November 18, 2015 at 9:39:23 PM UTC+7, Sergey wrote:I can't use your code when it's as a screenshot, please attach a text file. The code you screenshotted also doesn't appear to contain the part that you said actually causes the error, which is the chart redrawing. However, if that's your method for redrawing the chart, then the issue is that you create a new instance of the chart every time you redraw, where you should reuse the previous instance.On Tue, Nov 17, 2015 at 8:27 PM Kha Nguyen Dong <dongk...@gmail.com> wrote:
Thanks Sergey,I stored the code to draw chart and statistic's template in a PartialView. I use ajax to load the PartialView and insert it in a DIV. When i click submit again, I empty the DIV add insert the view into it again.the problem only happen when I draw chart => hover the column => redrawn => hover the column again.I think the chart need to be destroyed before I redrawn the new chart.Hope you can help me.Here is my code:
On Tuesday, November 17, 2015 at 9:39:13 PM UTC+7, Sergey wrote:Hi Kha,It's hard to say what's going on without any code that reproduces the issue. My guess is that either there is a better way to redraw the chart than what you're currently doing, or that the issue is fixed in version 43.On Tue, Nov 17, 2015 at 3:31 AM Kha Nguyen Dong <dongk...@gmail.com> wrote:
I'm developing statistic app using MVC. I click Submit to draw chart in the first time and hover on it's column.--
But when I click Submit again redraw the chart, I hover the column and it disappear, and it's tooltip seem like error.
Can someone show me the solution to solve this problem?
You received this message because you are subscribed to the Google Groups "Google Visualization API" group.
To unsubscribe from this group and stop receiving emails from it, send an email to google-visualizati...@googlegroups.com.
To post to this group, send email to google-visua...@googlegroups.com.
Visit this group at http://groups.google.com/group/google-visualization-api.
To view this discussion on the web visit https://groups.google.com/d/msgid/google-visualization-api/f0ac1391-8d6a-4f62-980a-310ed59e7909%40googlegroups.com.
For more options, visit https://groups.google.com/d/optout.
----![unnamed.gif]() Sergey Grabkovsky | SWE | gra...@google.com
Sergey Grabkovsky | SWE | gra...@google.com
You received this message because you are subscribed to the Google Groups "Google Visualization API" group.
To unsubscribe from this group and stop receiving emails from it, send an email to google-visualizati...@googlegroups.com.
To post to this group, send email to google-visua...@googlegroups.com.
Visit this group at http://groups.google.com/group/google-visualization-api.
To view this discussion on the web visit https://groups.google.com/d/msgid/google-visualization-api/9518415b-c9cd-4988-b2b1-b5a1c2cd1c8f%40googlegroups.com.
For more options, visit https://groups.google.com/d/optout.
--![unnamed.gif]() Sergey Grabkovsky | SWE | gra...@google.com
Sergey Grabkovsky | SWE | gra...@google.com
--
You received this message because you are subscribed to the Google Groups "Google Visualization API" group.
To unsubscribe from this group and stop receiving emails from it, send an email to google-visualizati...@googlegroups.com.
To post to this group, send email to google-visua...@googlegroups.com.
Visit this group at http://groups.google.com/group/google-visualization-api.
To view this discussion on the web visit https://groups.google.com/d/msgid/google-visualization-api/9b1a701d-1e71-402a-afe6-c540b1a60b41%40googlegroups.com.
For more options, visit https://groups.google.com/d/optout.
Kha Nguyen Dong
Nov 26, 2015, 9:17:17 PM11/26/15
to Google Visualization API
Hi Sergey,
I'm sorry, I'm too busy so I forgot to respond to you. I replace my code into your example, it worked without any bugs and I don't know why? I met another error "Object doesn't support property or method Contains" in IE, I fixed it by using frozen version v41. Luckily, the bug when redraw the chart was fixed.
To unsubscribe from this group and stop receiving emails from it, send an email to google-visualization-api+unsub...@googlegroups.com.
To post to this group, send email to google-visua...@googlegroups.com.
Visit this group at http://groups.google.com/group/google-visualization-api.
To view this discussion on the web visit https://groups.google.com/d/msgid/google-visualization-api/f0ac1391-8d6a-4f62-980a-310ed59e7909%40googlegroups.com.
For more options, visit https://groups.google.com/d/optout.
----![unnamed.gif]() Sergey Grabkovsky | SWE | gra...@google.com
Sergey Grabkovsky | SWE | gra...@google.com
You received this message because you are subscribed to the Google Groups "Google Visualization API" group.
To unsubscribe from this group and stop receiving emails from it, send an email to google-visualization-api+unsub...@googlegroups.com.
To post to this group, send email to google-visua...@googlegroups.com.
Visit this group at http://groups.google.com/group/google-visualization-api.
To view this discussion on the web visit https://groups.google.com/d/msgid/google-visualization-api/9518415b-c9cd-4988-b2b1-b5a1c2cd1c8f%40googlegroups.com.
For more options, visit https://groups.google.com/d/optout.
----![unnamed.gif]() Sergey Grabkovsky | SWE | gra...@google.com
Sergey Grabkovsky | SWE | gra...@google.com
You received this message because you are subscribed to the Google Groups "Google Visualization API" group.
To unsubscribe from this group and stop receiving emails from it, send an email to google-visualization-api+unsub...@googlegroups.com.
To post to this group, send email to google-visua...@googlegroups.com.
Visit this group at http://groups.google.com/group/google-visualization-api.
To view this discussion on the web visit https://groups.google.com/d/msgid/google-visualization-api/9b1a701d-1e71-402a-afe6-c540b1a60b41%40googlegroups.com.
For more options, visit https://groups.google.com/d/optout.
Reply all
Reply to author
Forward
0 new messages