Google Charts v47
208 views
Skip to first unread message

Daniel LaLiberte
Dec 20, 2019, 11:24:41 AM12/20/19
to Google Visualization API
As of now, the 'upcoming' version of Google Charts is v47. This release includes a large number of internal cleanups, and a few new features:
--
- Add loader setting to enable "safeMode".
- When set to true, all charts and tooltips that generate HTML from user-supplied data will sanitize it by stripping out unsafe elements and attributes.
- Add support for the "autoload" and "callback" parameters on the loader, to be backward compatible with the old jsapi loader.
- For corecharts
- Handle "zoomDelta" values below 1.0
- Add "maxTextLines" as a vertical axis option.
If all goes well, this 'upcoming' version will become 'current' in the first week of January.
dlaliberte@Google.com Cambridge MA
Daniel LaLiberte
Jan 6, 2020, 1:53:02 PM1/6/20
to Google Visualization API, google-char...@googlegroups.com
The 'current' version of Google Charts is now (within the hour) v47. Please let us know if you discover problems related to this new release.

Jeff Johnson
Feb 11, 2020, 9:22:56 AM2/11/20
to Google Visualization API
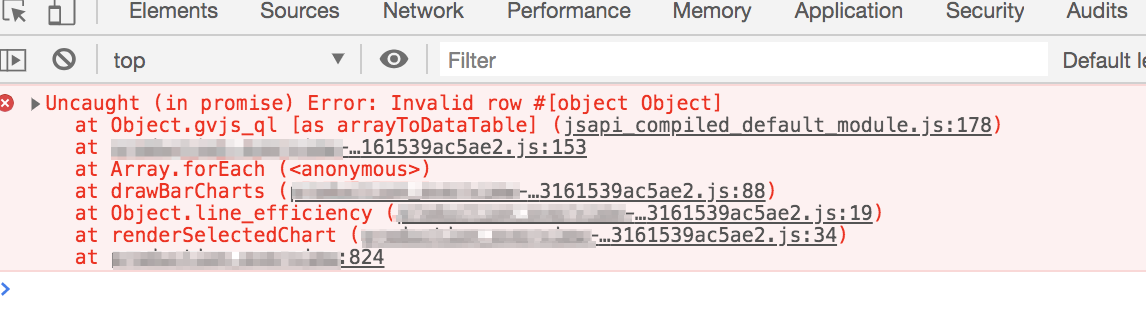
Hiya, I just noticed that the "last modified" header on https://www.gstatic.com/charts/loader.js says "Tue, 11 Feb 2020 04:46:35 GMT". Was there an unpublished fix, or other change? This might be causing issues. At least one other poster besides myself appears to be experiencing some kind of exception that is solved by explicitly loading version 46 instead of current.
Here's a small screencap of the exception:
dlali...@Google.com Cambridge MA--dlali...@Google.com Cambridge MA
Daniel LaLiberte
Feb 11, 2020, 9:39:45 AM2/11/20
to Google Visualization API
Yes, in fact there were a few unannounced updates of v47 last night, and another update just now. I've mostly been modifying the loader, in particular, to support more redirects that the old jsapi loader still supports. But along the way, I messed up by updating the loader with a version that was out of sync with the Google Charts library itself. So I also redeployed all of v47 last evening.
As far as I can see, everything should be working now, but there may be a few ways of loading and using Google Charts that I am not aware of that may still be causing issues. Please let me know the details of how you are loading Google Charts so I can reproduce the problem, including how you load the loader, load packages, and set up callbacks.
--
You received this message because you are subscribed to the Google Groups "Google Visualization API" group.
To unsubscribe from this group and stop receiving emails from it, send an email to google-visualizati...@googlegroups.com.
To view this discussion on the web visit https://groups.google.com/d/msgid/google-visualization-api/86f7c4ed-c792-485a-9a34-9a9e90356432%40googlegroups.com.
dlaliberte@Google.com Cambridge MA
go/gviz-headcount
Jeff Johnson
Feb 11, 2020, 12:32:48 PM2/11/20
to Google Visualization API
Hi Dan, thanks for the quick updates! I also appreciate the transparency.
Here's the snippet we're using to load google charts: https://gist.github.com/jmjohnson/3c37f229d36fd79be680283269b0646a
$j is jquery v1.9.1
We don't have any other kinds of google chart loading setups. I bet things are working if we were to switch to current again. I'll follow up if that's not the case.
Thanks again for all your help! (and for free no less!)
To unsubscribe from this group and stop receiving emails from it, send an email to google-visualization-api+unsub...@googlegroups.com.
To view this discussion on the web visit https://groups.google.com/d/msgid/google-visualization-api/86f7c4ed-c792-485a-9a34-9a9e90356432%40googlegroups.com.
--
Daniel LaLiberte
Feb 11, 2020, 12:55:54 PM2/11/20
to Google Visualization API
Hi Jeff,
Your snippet looks fine as it is, but it wouldn't work without the key ingredient, the part that loads the loader. I expect you are using the new loader at https://www.gstatic.com/charts/loader.js, but what else is going on? Since you are using jquery, you also must be loading that, but how? It would be best to point at a web page that does it all, and then I can also see its source code from that same page.
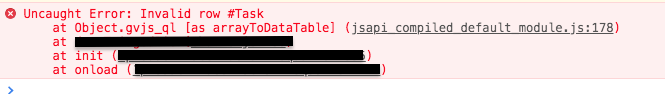
And maybe just switch back to 'current' and all will be resolved. But elsewhere, someone is having issues with the arrayToDataTable function, so I am open to whatever bizarre issues might come up.
To unsubscribe from this group and stop receiving emails from it, send an email to google-visualizati...@googlegroups.com.
To view this discussion on the web visit https://groups.google.com/d/msgid/google-visualization-api/86f7c4ed-c792-485a-9a34-9a9e90356432%40googlegroups.com.
--
--
You received this message because you are subscribed to the Google Groups "Google Visualization API" group.
To unsubscribe from this group and stop receiving emails from it, send an email to google-visualizati...@googlegroups.com.
To view this discussion on the web visit https://groups.google.com/d/msgid/google-visualization-api/949f720d-30b5-4d93-88aa-8469005d1a9c%40googlegroups.com.

NDIOM MAYAKA
Feb 11, 2020, 2:03:59 PM2/11/20
to Google Visualization API
Bonjour.
Mon pie chart qui utilise le theme "Material" ne fonctionne plus....
Jeff Johnson
Feb 11, 2020, 2:16:02 PM2/11/20
to Google Visualization API
Gotcha.
Unfortunately, our app doesn't have any public facing pages. I'll see if I can setup a test environment or something. Or... would a chrome dev tools HAR file be sufficient?
In any case, since v46 seems to be working fine, I feel no more urgency around this.
To unsubscribe from this group and stop receiving emails from it, send an email to google-visualization-api+unsub...@googlegroups.com.
To view this discussion on the web visit https://groups.google.com/d/msgid/google-visualization-api/86f7c4ed-c792-485a-9a34-9a9e90356432%40googlegroups.com.
--
--
You received this message because you are subscribed to the Google Groups "Google Visualization API" group.
To unsubscribe from this group and stop receiving emails from it, send an email to google-visualization-api+unsub...@googlegroups.com.
To view this discussion on the web visit https://groups.google.com/d/msgid/google-visualization-api/949f720d-30b5-4d93-88aa-8469005d1a9c%40googlegroups.com.
--
Daniel LaLiberte
Feb 11, 2020, 2:44:06 PM2/11/20
to Google Visualization API
Here is an example of a 'material' pie chart. Does it work for you? https://jsfiddle.net/dlaliberte/b5jdar7y/
On Tue, Feb 11, 2020 at 2:04 PM NDIOM MAYAKA <hnd...@gmail.com> wrote:
Bonjour.Mon pie chart qui utilise le theme "Material" ne fonctionne plus....
--
You received this message because you are subscribed to the Google Groups "Google Visualization API" group.
To unsubscribe from this group and stop receiving emails from it, send an email to google-visualizati...@googlegroups.com.
To view this discussion on the web visit https://groups.google.com/d/msgid/google-visualization-api/fe170ede-6fda-4a81-b5d3-e5f3272bc052%40googlegroups.com.
dlaliberte@Google.com Cambridge MA
go/gviz-headcount
Daniel LaLiberte
Feb 11, 2020, 2:46:07 PM2/11/20
to Google Visualization API
I've never tried to use a chrome dev tools HAR file, but it sounds like it will either reveal too much of your internal code, or not enough to help. A simple test case would be best, but I guess don't bother unless this problem persists, say in future upgrades.
To unsubscribe from this group and stop receiving emails from it, send an email to google-visualizati...@googlegroups.com.
To view this discussion on the web visit https://groups.google.com/d/msgid/google-visualization-api/86f7c4ed-c792-485a-9a34-9a9e90356432%40googlegroups.com.
--
--
You received this message because you are subscribed to the Google Groups "Google Visualization API" group.
To unsubscribe from this group and stop receiving emails from it, send an email to google-visualizati...@googlegroups.com.
To view this discussion on the web visit https://groups.google.com/d/msgid/google-visualization-api/949f720d-30b5-4d93-88aa-8469005d1a9c%40googlegroups.com.
--
--
You received this message because you are subscribed to the Google Groups "Google Visualization API" group.
To unsubscribe from this group and stop receiving emails from it, send an email to google-visualizati...@googlegroups.com.
To view this discussion on the web visit https://groups.google.com/d/msgid/google-visualization-api/cdf490e7-5f47-41c3-8c88-4a9531473568%40googlegroups.com.

AB
Feb 12, 2020, 2:37:32 PM2/12/20
to Google Visualization API
I am still seeing issues with some charts, pie charts in particular. It loads perfectly with version 46, but current errors out.
To unsubscribe from this group and stop receiving emails from it, send an email to google-visualization-api+unsub...@googlegroups.com.
To view this discussion on the web visit https://groups.google.com/d/msgid/google-visualization-api/86f7c4ed-c792-485a-9a34-9a9e90356432%40googlegroups.com.
--
Daniel LaLiberte
Feb 12, 2020, 4:37:53 PM2/12/20
to Google Visualization API
Hi AB,
Given that I don't have a way to reproduce this problem with PieChart in v47, I am indeed curious what is happening in the page where you do see it. Can you share the page here, or privately to me?
To unsubscribe from this group and stop receiving emails from it, send an email to google-visualizati...@googlegroups.com.
To view this discussion on the web visit https://groups.google.com/d/msgid/google-visualization-api/86f7c4ed-c792-485a-9a34-9a9e90356432%40googlegroups.com.
--
--
You received this message because you are subscribed to the Google Groups "Google Visualization API" group.
To unsubscribe from this group and stop receiving emails from it, send an email to google-visualizati...@googlegroups.com.
To view this discussion on the web visit https://groups.google.com/d/msgid/google-visualization-api/5908228f-8e05-4730-9435-2607f5d144ea%40googlegroups.com.
AB
Feb 12, 2020, 5:02:53 PM2/12/20
to Google Visualization API
It's an internal page. How can I show/share it with you privately?
To unsubscribe from this group and stop receiving emails from it, send an email to google-visualization-api+unsub...@googlegroups.com.
To view this discussion on the web visit https://groups.google.com/d/msgid/google-visualization-api/86f7c4ed-c792-485a-9a34-9a9e90356432%40googlegroups.com.
--
--
You received this message because you are subscribed to the Google Groups "Google Visualization API" group.
To unsubscribe from this group and stop receiving emails from it, send an email to google-visualization-api+unsub...@googlegroups.com.
To view this discussion on the web visit https://groups.google.com/d/msgid/google-visualization-api/5908228f-8e05-4730-9435-2607f5d144ea%40googlegroups.com.
--

Maurizio Spedicati
Feb 13, 2020, 8:32:43 AM2/13/20
to Google Visualization API
Also I have the same problem with v47 with my Raspberry. I was forced to fix v46
dlali...@Google.com Cambridge MA
AB
Feb 13, 2020, 12:06:53 PM2/13/20
to Google Visualization API
I was able to narrow down that in my case it is an interop issue with the prototype version I'm using. I was using prototype 1.7.2.0. When I switched to latest prototype 1.7.3.0 it worked with current (47) version.
Maurizio S
Feb 13, 2020, 12:57:59 PM2/13/20
to Google Visualization API
Dear AB,
thank you very much, you solved also my problem!
I was using prototype 1.7.1 and after updating to version 1.7.3 all work well.
Now I'm usnig again 'current' option.
AB
Feb 13, 2020, 9:50:41 PM2/13/20
to Google Visualization API
Awesome! Glad to have helped!
Reply all
Reply to author
Forward
0 new messages