Line chart with area from line 1 to line 2 but only if value 1 > value 2
14 views
Skip to first unread message

Matteo Pelucco
Sep 22, 2016, 9:56:16 AM9/22/16
to Google Visualization API
Hello everybody, 

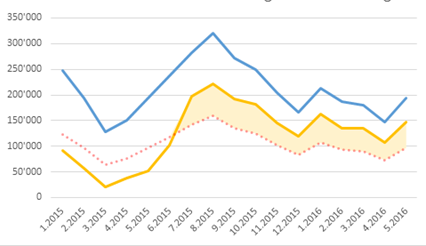
I have been asked to produce a chart like this for an energetic domain:
The idea is to have 2 energetic values:
BLUE (upper value)
YELLOW (lower value)
then we have a threshold, the DOTTED value.
Customers pay only the energy > of the threshold AND < of YELLOW.
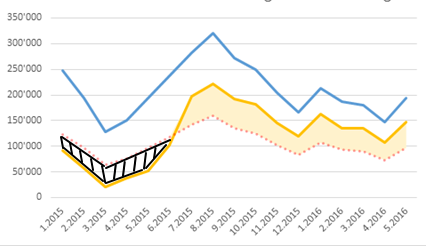
Any idea on how to do this? I already tried a solution, but also the energy < of threshold and > of YELLOW is colored:
(the black area must be left not colored).
Thanks for any suggestion!
Matteo

Daniel LaLiberte
Sep 22, 2016, 11:04:36 AM9/22/16
to Google Visualization API
We don't have a feature for coloring the area between two lines, although given several requests for this kind of feature, it sounds like it would be useful.
With a fair amount of hacking, I believe you could probably get almost the same effect by using stacked areas and styling the lines and fill areas appropriately.
Reply all
Reply to author
Forward
0 new messages