Timeline Chart issue
16 views
Skip to first unread message

Ayon Saha
Sep 23, 2016, 1:46:14 PM9/23/16
to Google Visualization API
Hi,
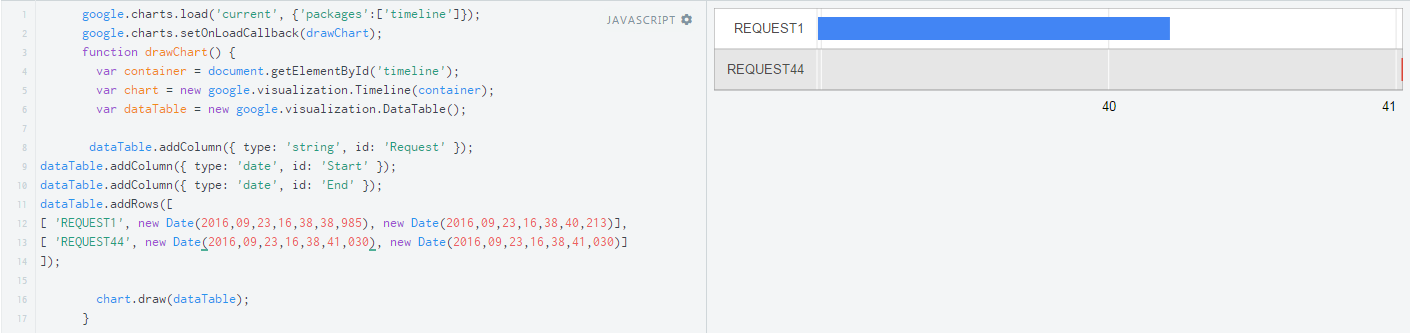
The "Timeline chart" is having issues calculating and plotting the chart.
The code:
'REQUEST44', new Date(2016,09,23,16,38,41,030), new Date(2016,09,23,16,38,41,030)] works fine but 'REQUEST44', new Date(2016,09,23,16,38,41,028), new Date(2016,09,23,16,38,41,030)] throws the below issue. I am not sure if I am missing anything here.
Issue:

Works Fine:
Reply all
Reply to author
Forward
0 new messages