Chart Columns Will Not Expand Across Entire Chart Area
9 views
Skip to first unread message

Edward Hahn
Oct 8, 2015, 8:53:00 PM10/8/15
to Google Visualization API
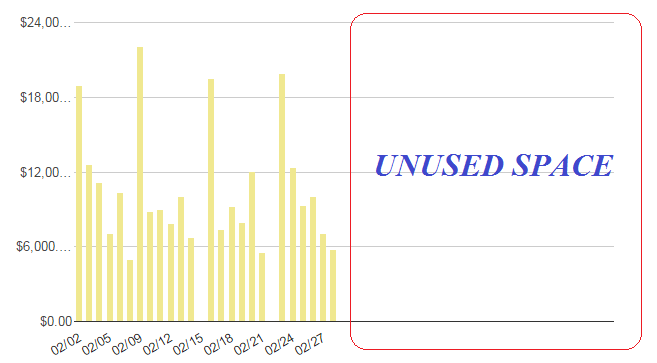
For some reason I can't get my column bars to expand across the entire chart area. Notice in the screenshot below that the columns only occupy half the space of the chart area. As more data points (and columns) are added, the columns simply get squeezed together, rather than expand across the entire width of the chart area. My chart options are shown below. How do I format the chart so that the entire chart area is used?
var options =
{
width: 1150,
height: 400,
bar: {groupWidth: "61.8%"},
legend: {position: "none"},
vAxis: {format:'currency'},
chartArea:{left:'10%',top:'5%',width:'100%',height:'75%'},
};
Reply all
Reply to author
Forward
0 new messages