Northern high-latitude permafrost and terrestrial carbon response to solar geoengineering

ayesha iqbal
Authors: Yangxin Chen1, Duoying Ji1, Qian Zhang1, John C. Moore1,2,3, Olivier Boucher4, Andy Jones5, Thibaut Lurton4, Michael J. Mills7, Ulrike Niemeier8, Roland Séférian6, and Simone Tilmes7Received: 16 Jul 2022 – Discussion started: 22 Jul 2022
Abstract. The northern high-latitude permafrost contains almost twice the carbon content of the atmosphere, and it is widely considered as a non-linear and tipping element in the Earth's climate system under global warming. Solar geoengineering is a means of mitigating temperature rise and reduce some of the associated climate impacts by increasing the planetary albedo, including permafrost thaw. We analyze the permafrost response as simulated by five earth system models (ESMs) under four future scenarios; two solar geoengineering scenarios (G6solar and G6sulfur) restore the global temperature from the high emission scenario (ssp585) levels to the moderate mitigation scenario (ssp245) levels via solar dimming and stratospheric aerosol injection. G6solar and G6sulfur nearly restore the northern high-latitude permafrost area from ssp585 levels to those under ssp245. But deeper active layer thickness and more exposed unfrozen soil organic carbon are produced due to robust residual high-latitude warming, especially over Eurasia. However, G6solar and G6sulfur accumulate more soil carbon over the northern high-latitude permafrost region due to enhanced CO2 fertilization effects relative to ssp245 and weakened heterotrophic respiration relative to ssp585. The asynchronous changes in soil carbon inputs and soil carbon decomposition directly result from decoupling of temperature and atmospheric CO2 concentration under solar geoengineering. The permafrost ecosystem remains a carbon sink throughout this century under all four scenarios, and solar geoengineering can delay the transition of northern high-latitude permafrost ecosystem from carbon sink to carbon source.
Source: European Geosciences Union
ayesha iqbal
The northern-high-latitude permafrost contains almost twice the carbon content of the atmosphere, and it is widely considered to be a non-linear and tipping element in the earth's climate system under global warming. Solar geoengineering is a means of mitigating temperature rise and reduces some of the associated climate impacts by increasing the planetary albedo; the permafrost thaw is expected to be moderated under slower temperature rise. We analyze the permafrost response as simulated by five fully coupled earth system models (ESMs) and one offline land surface model under four future scenarios; two solar geoengineering scenarios (G6solar and G6sulfur) based on the high-emission scenario (ssp585) restore the global temperature from the ssp585 levels to the moderate-mitigation scenario (ssp245) levels via solar dimming and stratospheric aerosol injection. G6solar and G6sulfur can slow the northern-high-latitude permafrost degradation but cannot restore the permafrost states from ssp585 to those under ssp245. G6solar and G6sulfur tend to produce a deeper active layer than ssp245 and expose more thawed soil organic carbon (SOC) due to robust residual high-latitude warming, especially over northern Eurasia. G6solar and G6sulfur preserve more SOC of 4.6 ± 4.6 and 3.4 ± 4.8 Pg C (coupled ESM simulations) or 16.4 ± 4.7 and 12.3 ± 7.9 Pg C (offline land surface model simulations), respectively, than ssp585 in the northern near-surface permafrost region. The turnover times of SOC decline slower under G6solar and G6sulfur than ssp585 but faster than ssp245. The permafrost carbon–climate feedback is expected to be weaker under solar geoengineering.
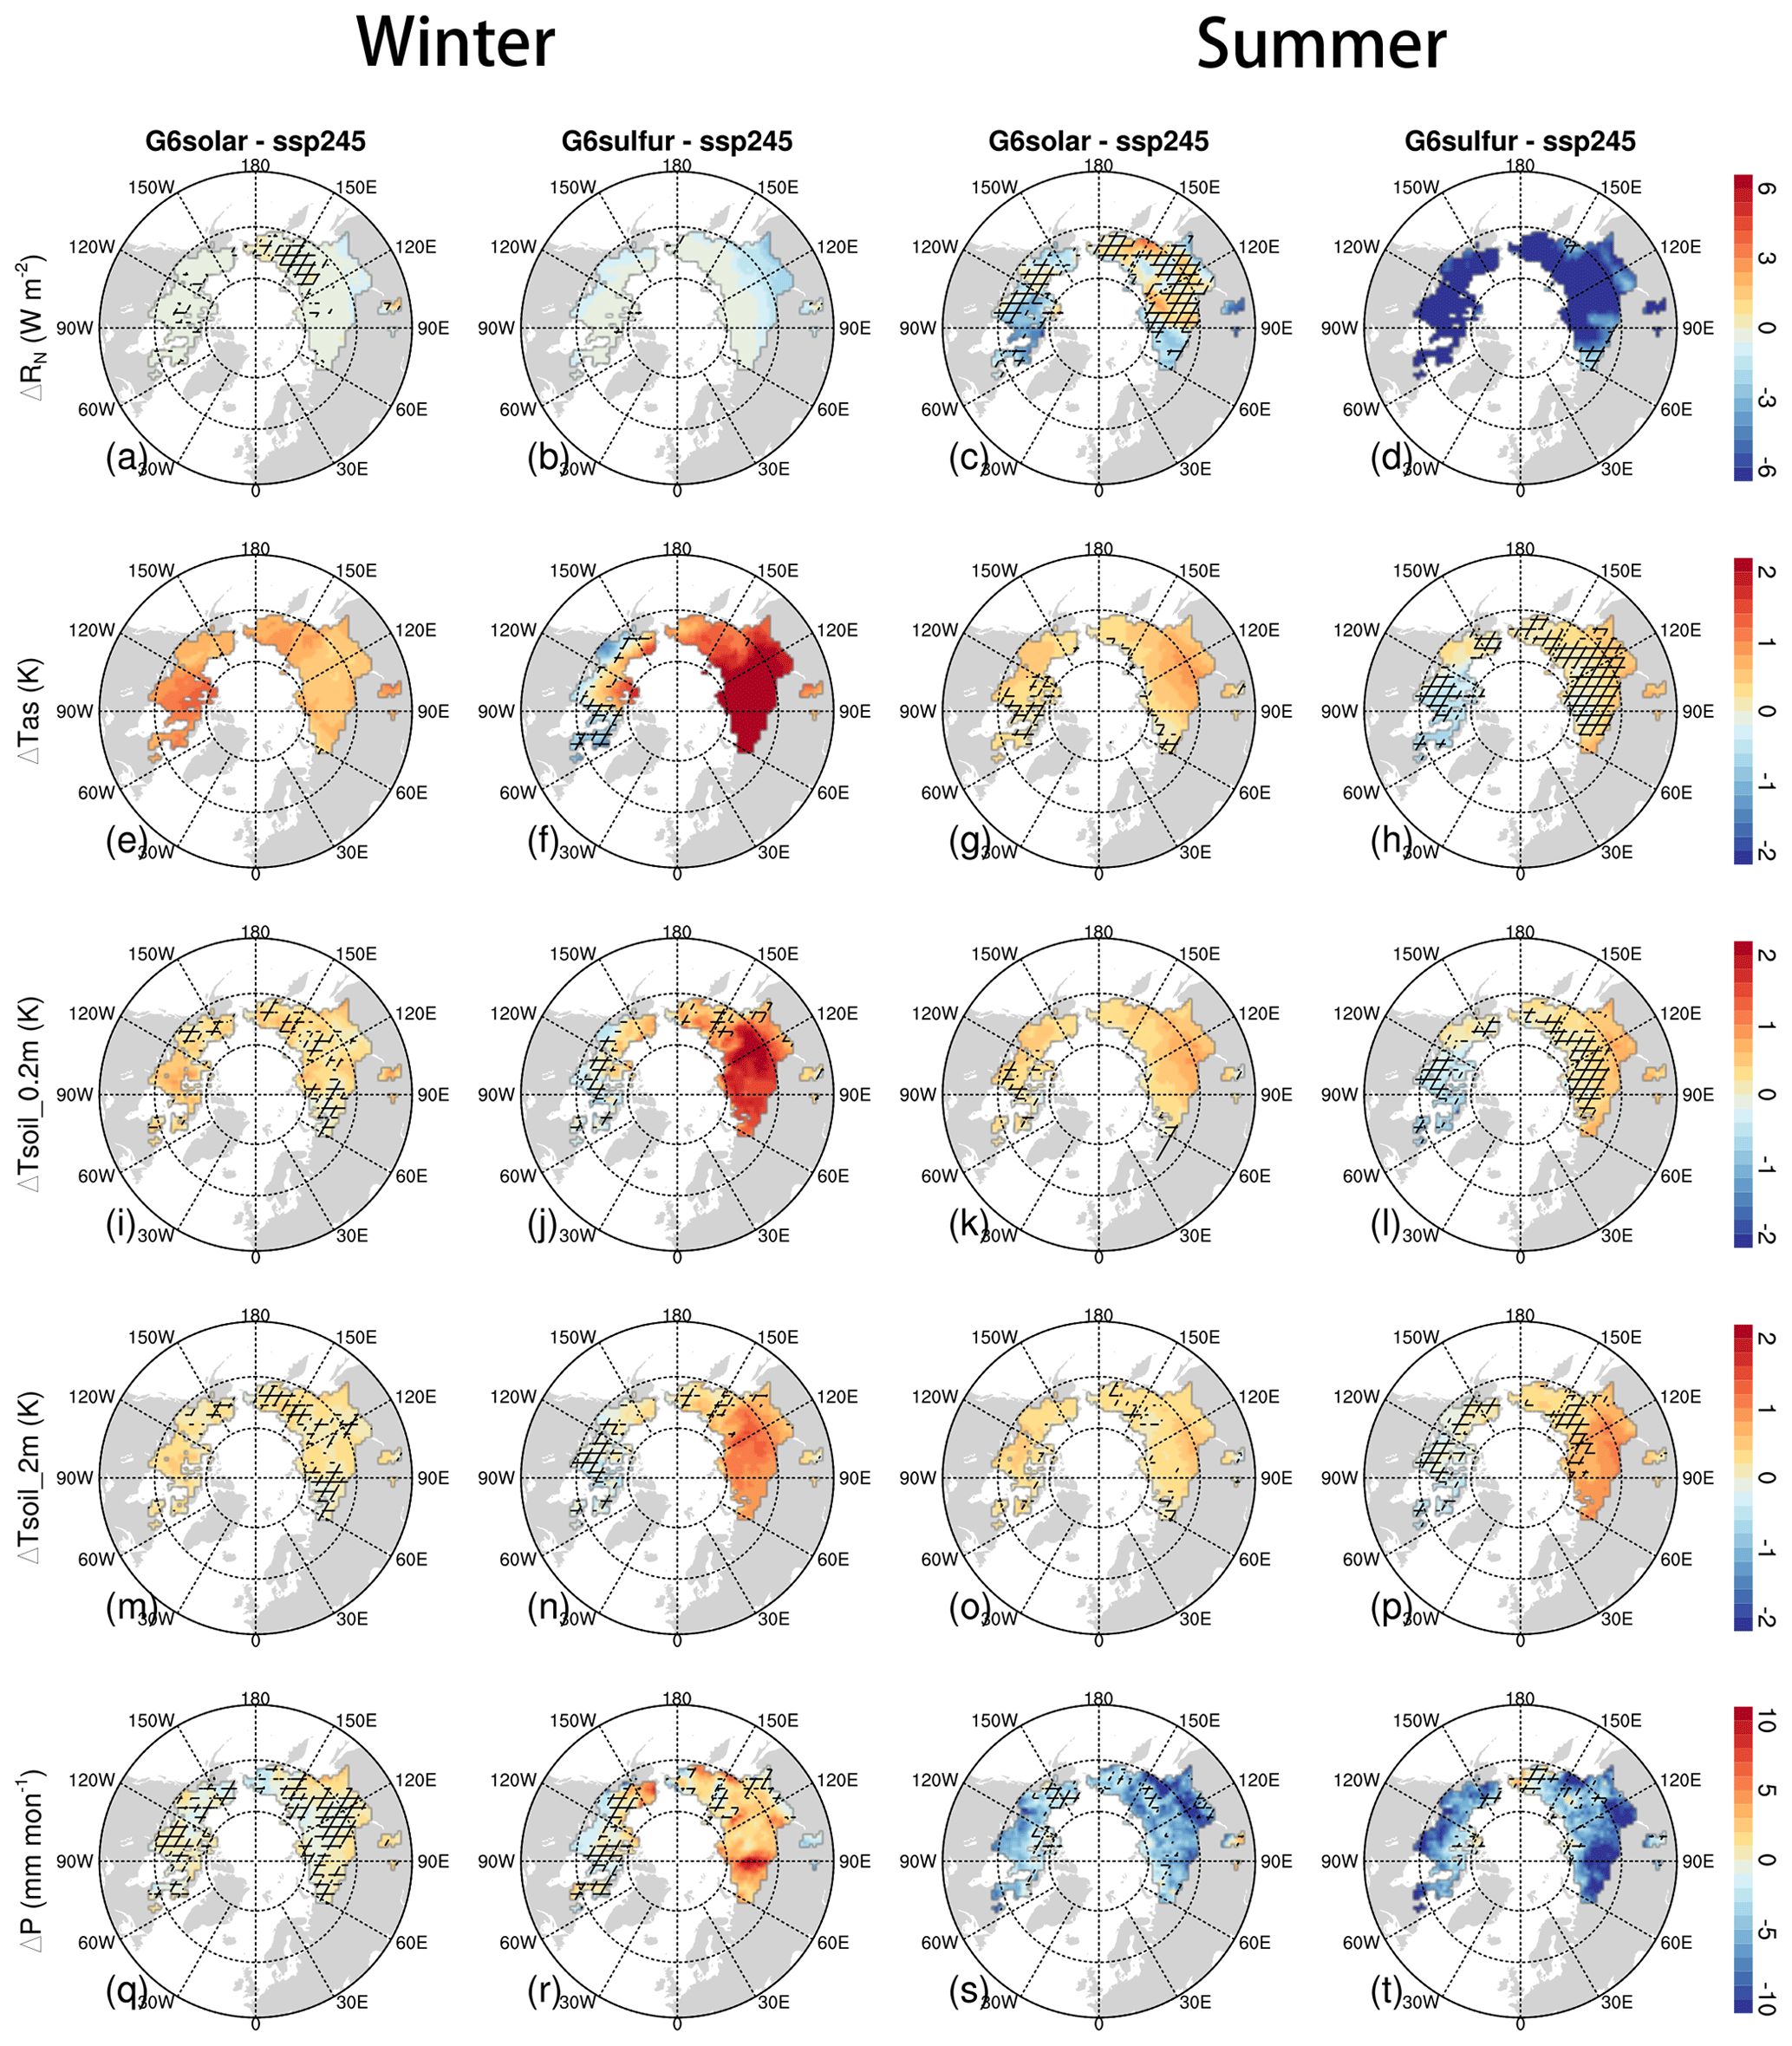
Figure 1The multi-model mean changes in surface-absorbed shortwave radiation (ΔRN; a, b, c, d), near-surface air temperature (ΔTas; e, f, g, h), 0.2 m soil temperature (ΔTsoil_0.2m; i, j, k, l), 2 m soil temperature (ΔTsoil_2m; m, n, o, p), and precipitation (ΔP; q, r, s, t) under G6solar and G6sulfur relative to ssp245 for the period 2080–2099 over the baseline PF50 % region. The left two columns show changes in winter (December, January, and February); the right two columns show changes in summer (June, July, and August). The hatched area in each panel indicates where fewer than 80 % of the ESMs (four out of five) agree on the sign of changes.
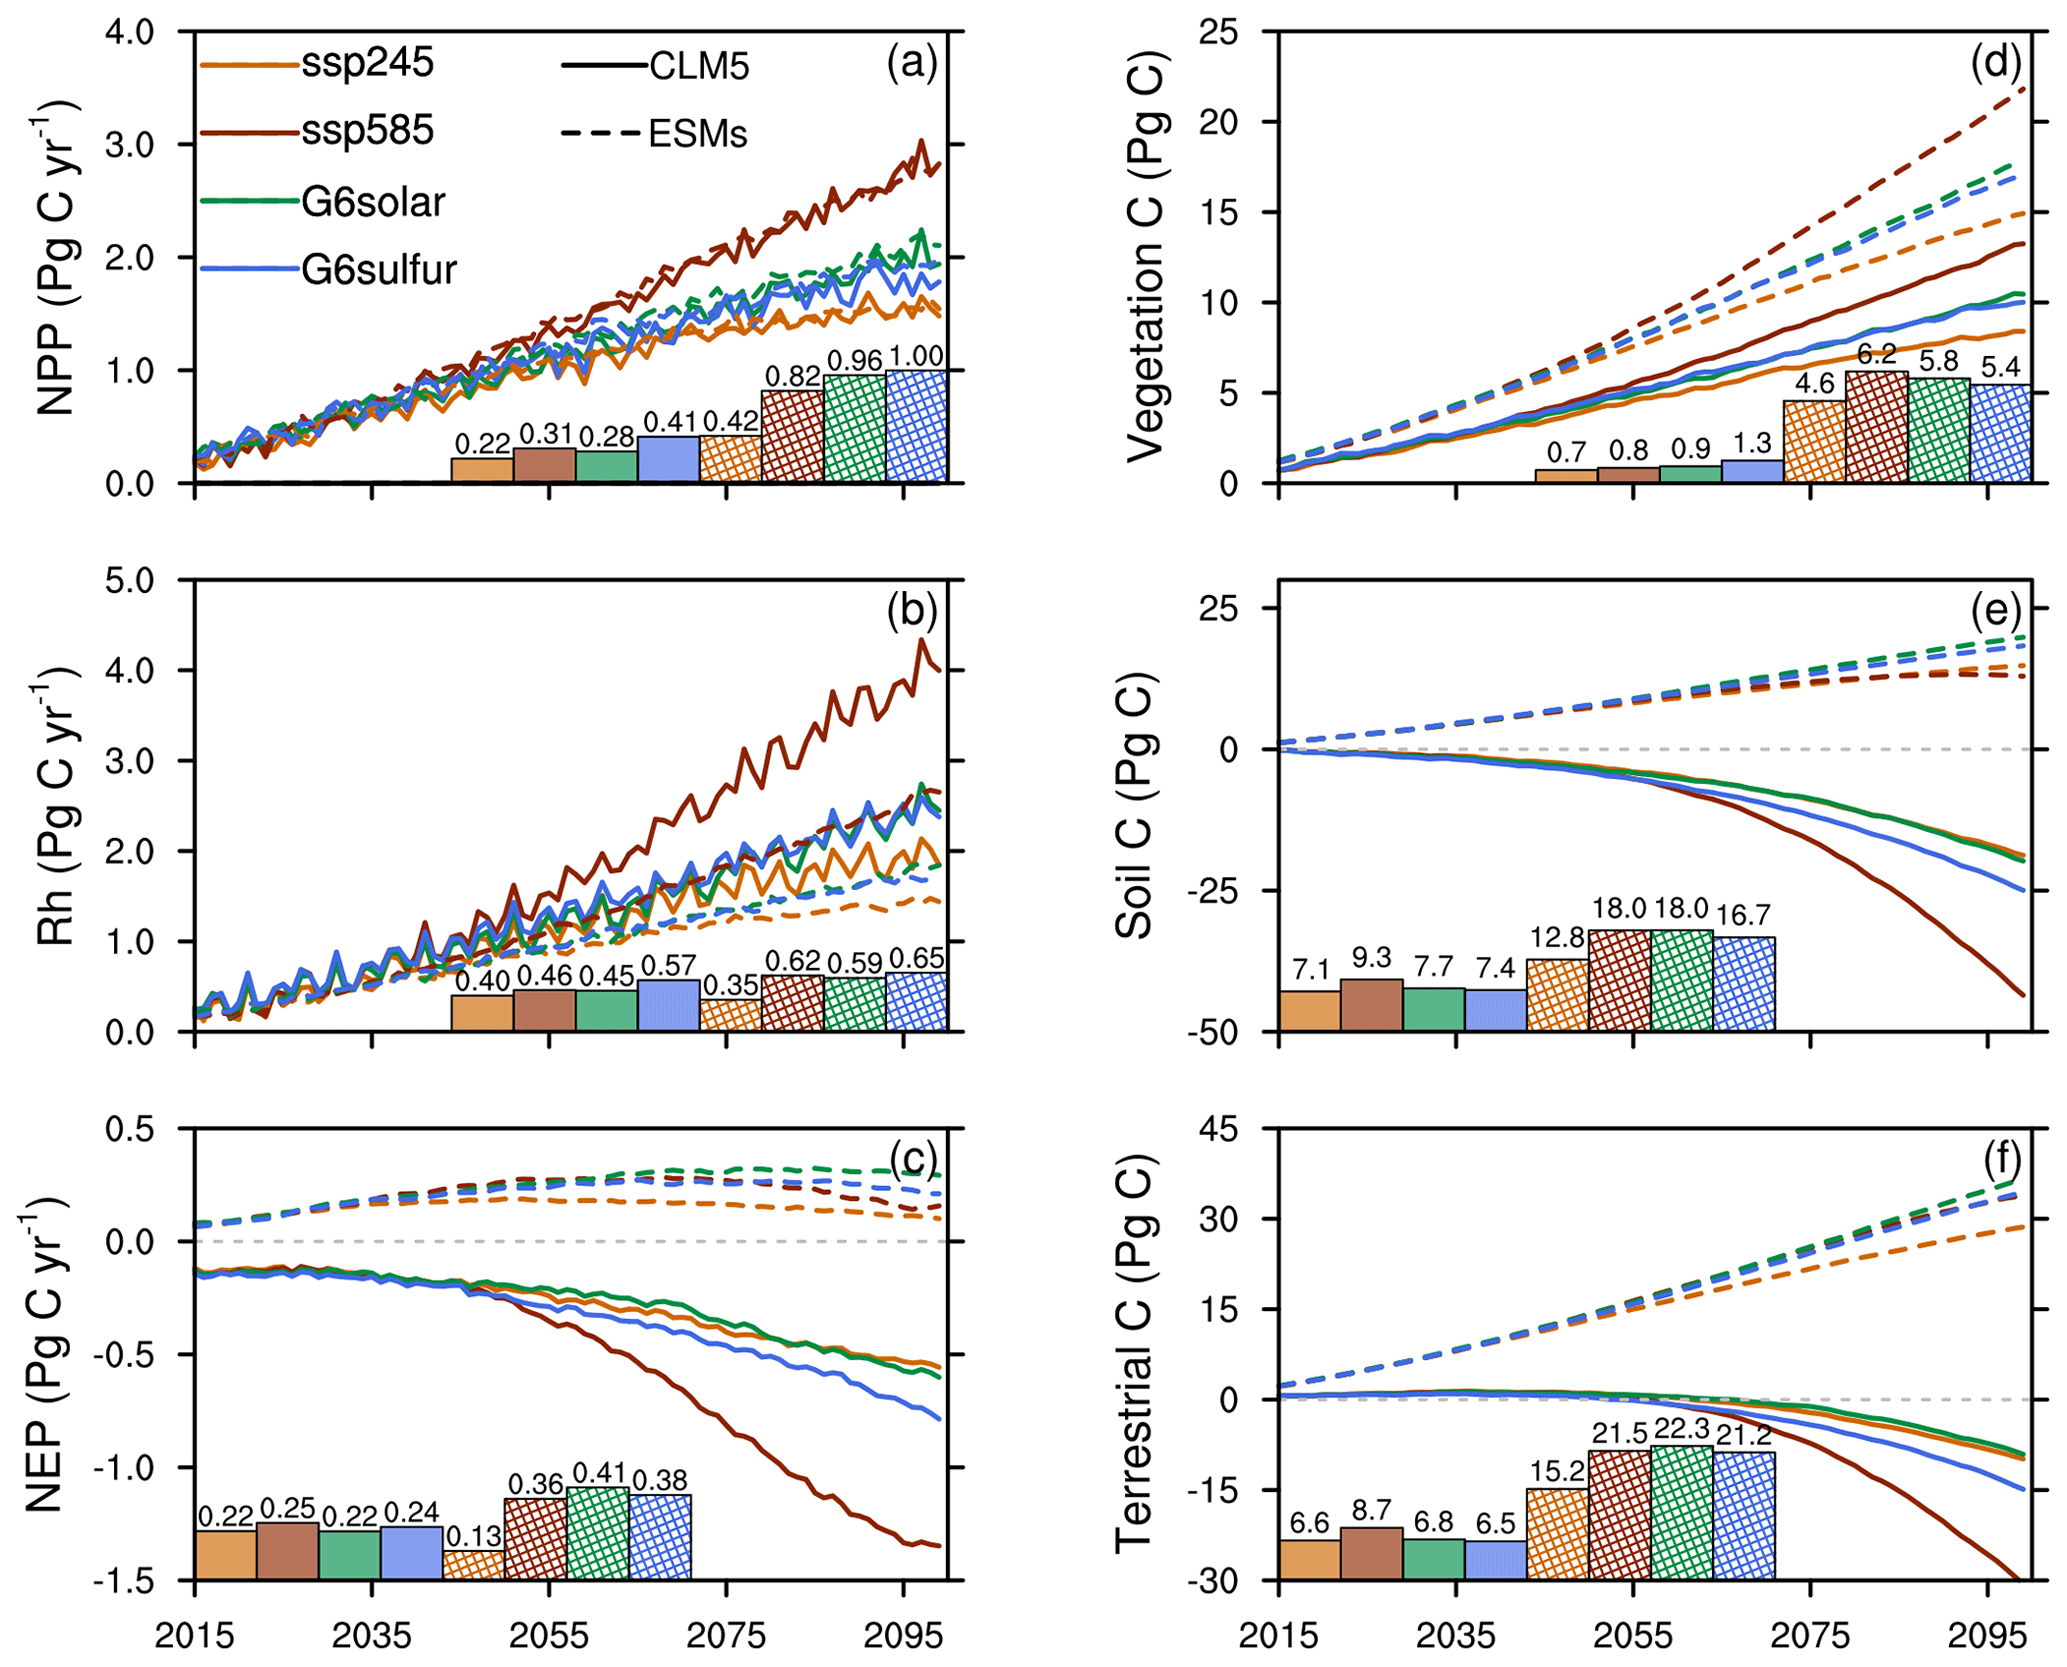
Figure 4The multi-model mean changes in terrestrial carbon fluxes and carbon storages over the baseline permafrost region during the period 2015–2099 relative to the baseline period 1995–2014 under ssp245, ssp585, G6solar, and G6sulfur. The left column shows changes in NPP (a), Rh (b), and NEP (c). The right column shows changes in vegetation (d), soil (e) and terrestrial (f) carbon storages. In each panel, bar charts denote 1 standard deviation from the multi-model mean averaged over the period 2080–2099, and the number above each bar denotes its magnitude. Solid lines and filled solid bars represent the anomaly-forcing CLM5 simulations. Dashed lines and hatched bars represent the ESM simulations. In panel (c), an 11-year running average is applied to an NEP time series to filter its large inter-annual variation.
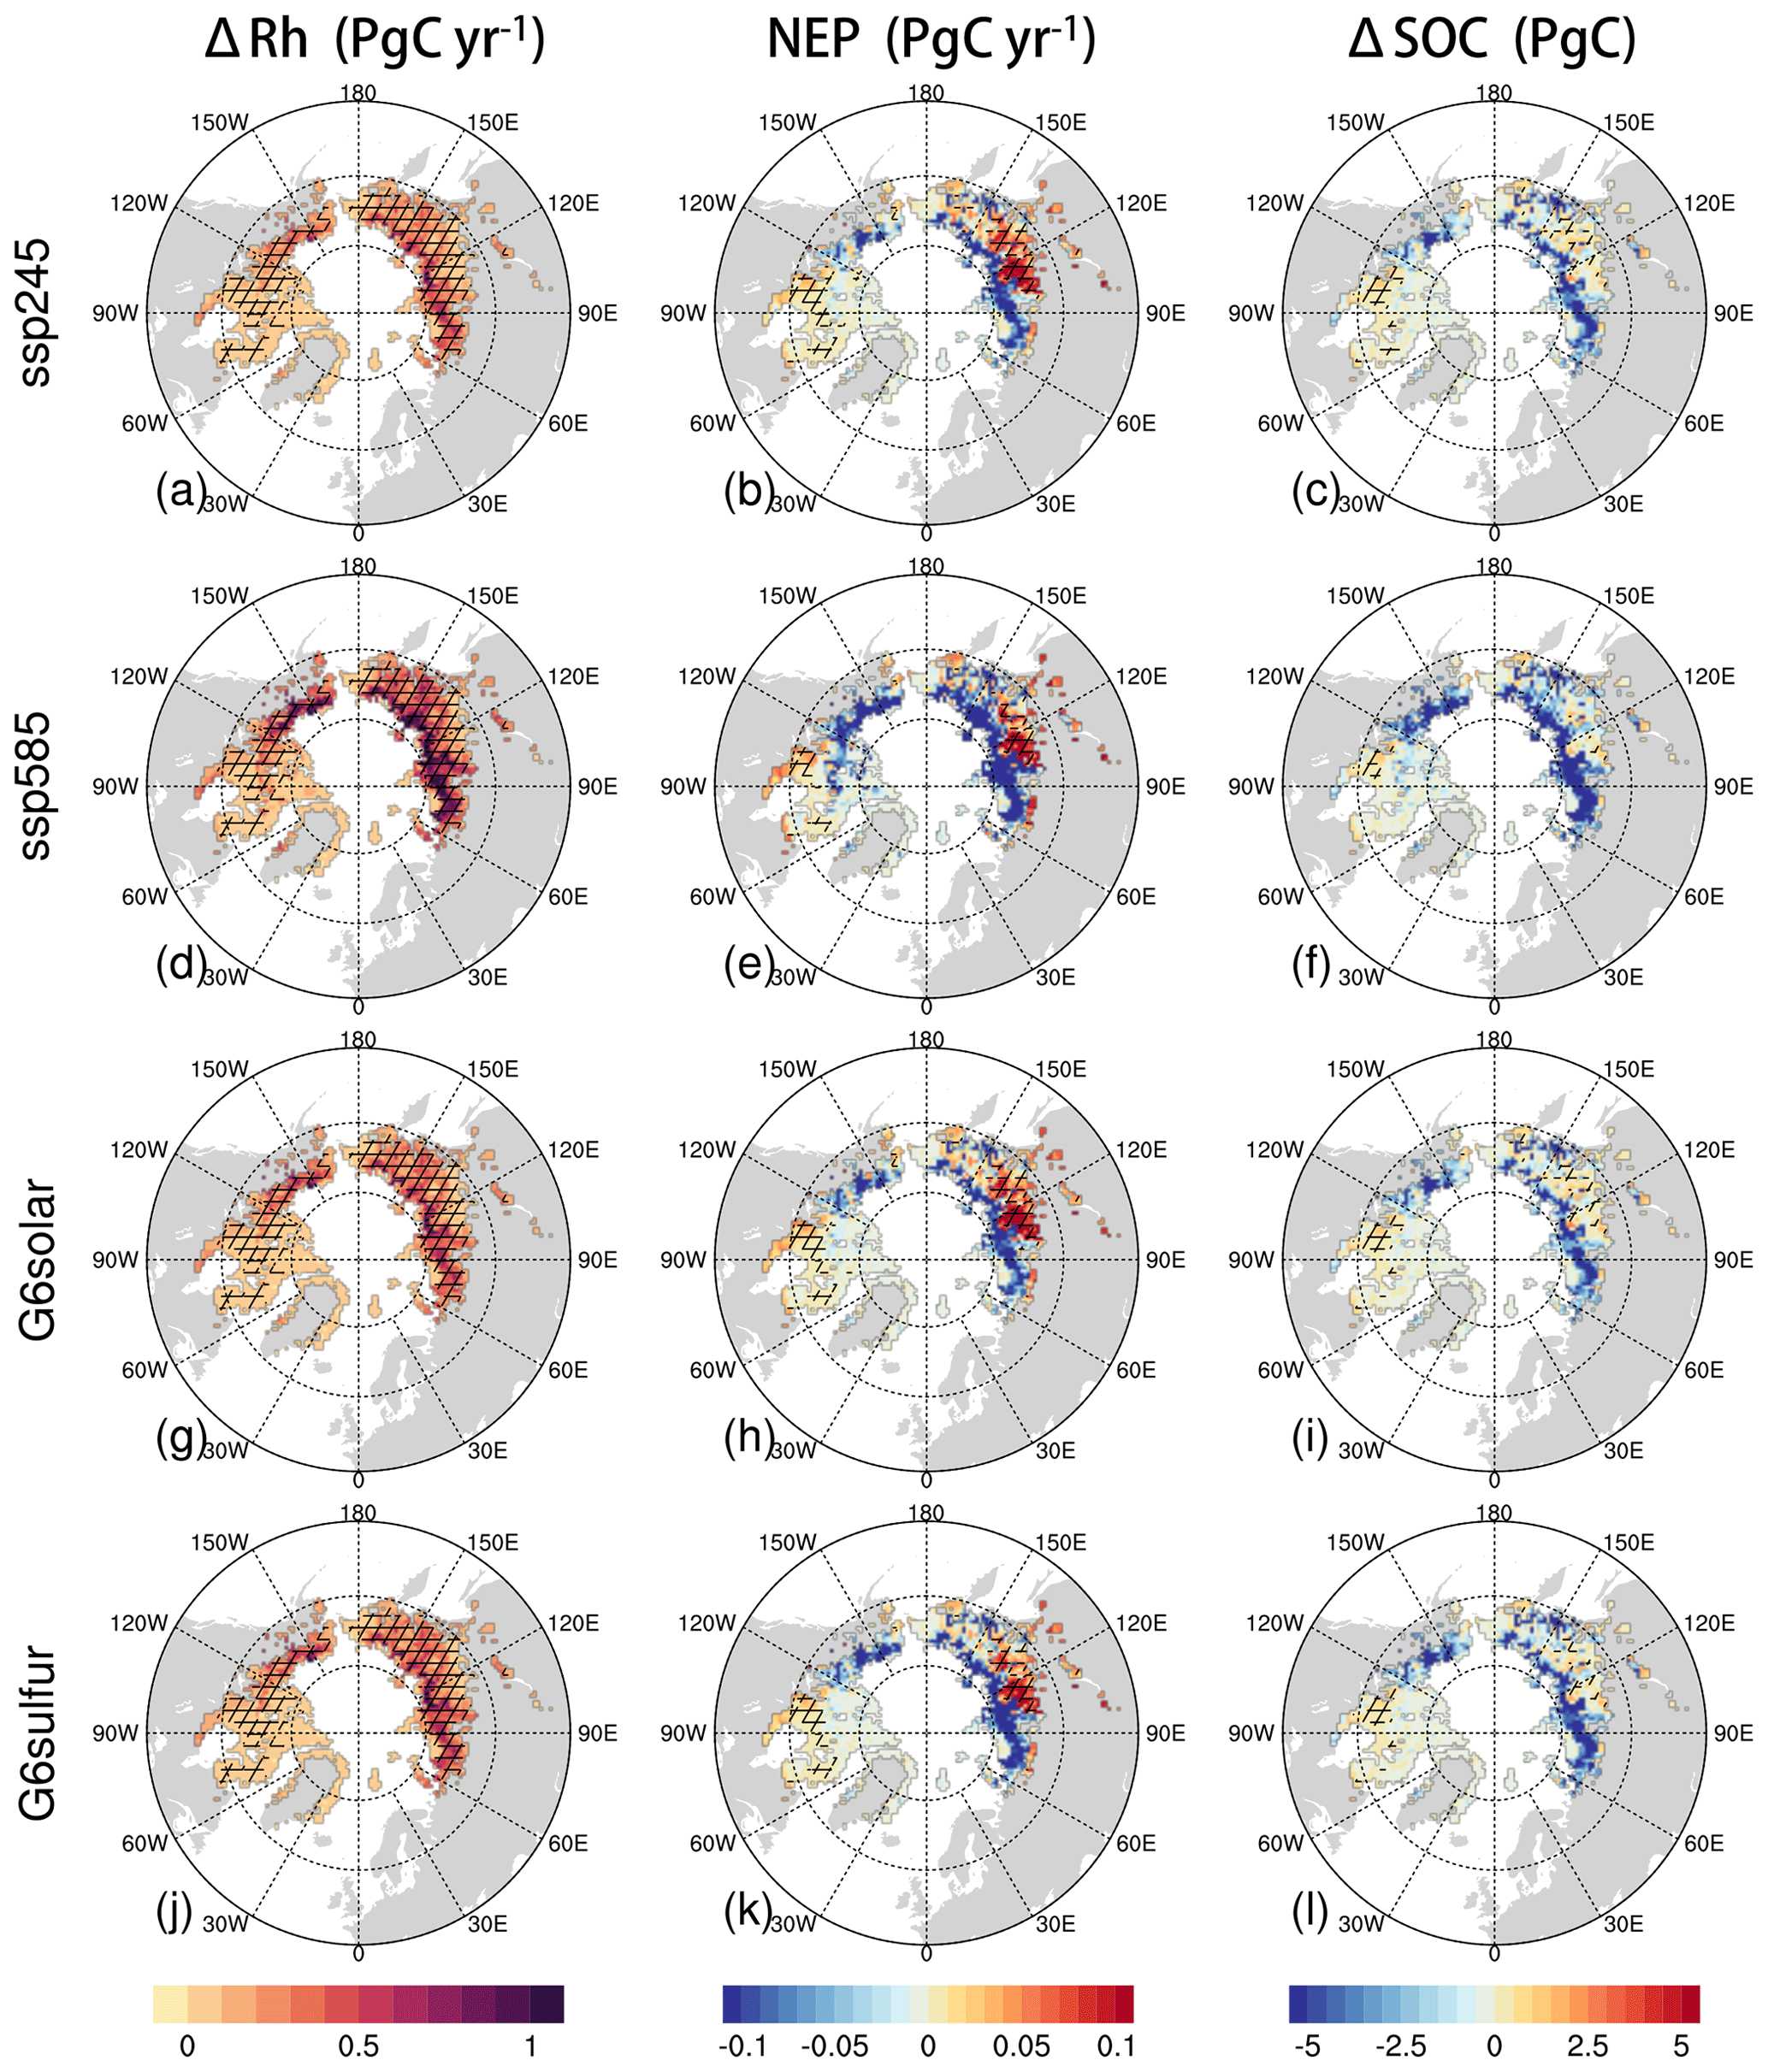
Figure 6The multi-model mean changes in Rh (left column) and soil carbon storage (right column) averaged for the period 2080–2099 under ssp245, ssp585, G6solar, and G6sulfur relative to the baseline period 1995–2014 over the baseline permafrost region in the anomaly-forcing CLM5 simulations. The middle column shows NEP for the period 2080–2099. The hatched area indicates where the sign of the plotted field is the same for the anomaly-forcing CLM5 simulations and corresponding ESM simulations in terms of multi-model mean.
Source: European Geosciences Union