Detection of large-scale cloud microphysical changes within a major shipping corridor after implementation of the International Maritime Organization 2020 fuel sulfur regulations

Geoengineering News
New regulations from the International Maritime Organization (IMO) limiting sulfur emissions from the shipping industry are expected to have large benefits in terms of public health but may come with an undesired side effect: acceleration of global warming as the climate-cooling effects of ship pollution on marine clouds are diminished. Previous work has found a substantial decrease in the detection of ship tracks in clouds after the IMO 2020 regulations went into effect, but changes in large-scale cloud properties have been more equivocal. Using a statistical technique that estimates counterfactual fields of what large-scale cloud and radiative properties within an isolated shipping corridor in the southeastern Atlantic would have been in the absence of shipping, we confidently detect a reduction in the magnitude of cloud droplet effective radius decreases within the shipping corridor and find evidence for a reduction in the magnitude of cloud brightening as well. The instantaneous radiative forcing due to aerosol–cloud interactions from the IMO 2020 regulations is estimated as O(1 W m−2) within the shipping corridor, lending credence to global estimates of O(0.1 W m−2). In addition to their geophysical significance, our results also provide independent evidence for general compliance with the IMO 2020 regulations.
Radiative forcing implications
Assuming that the Terra-based re and Acld perturbations are dominated by the Twomey effect as in D20, it is possible to estimate the instantaneous radiative forcing due to aerosol–cloud interactions (IRFACI; Forster et al., 2021) from the IMO 2020 regulations within the shipping corridor (see Methods in Appendix A). Results are shown in Fig. 5 for the 2002–2019 climatology, 2020–2022, and their difference (interpreted as the effect of the IMO 2020 regulations). The Twomey effect estimates are much better constrained for the calculations using re, but those using Acld show consistent results. The IMO 2020 regulations led to a ∼ 2 W m−2 IRFACI within the shipping corridor during austral spring and a ∼ 0.5 W m−2 IRFACI in the annual mean. Applying this ∼ 35 %–70 % decline in IRFACI to the −0.1 to −0.6 W m−2 range of forcing due to shipping emissions from climate models (Capaldo et al., 1999; Lauer et al., 2007; Peters et al., 2013; Righi et al., 2011; Sofiev et al., 2018), global forcing values of O(0.1 W m−2) due to the IMO 2020 regulations are plausible. The strongest shipping effect in Lauer et al. (2007) represented 40 % of their global ACI; a 70 % reduction from that fraction would represent a forcing of 0.2±0.1 W m−2 based on the currently assessed IRFACI value of 0.7±0.5 W m−2, or 0.3±0.2 W m−2 including adjustments (Forster et al., 2021)
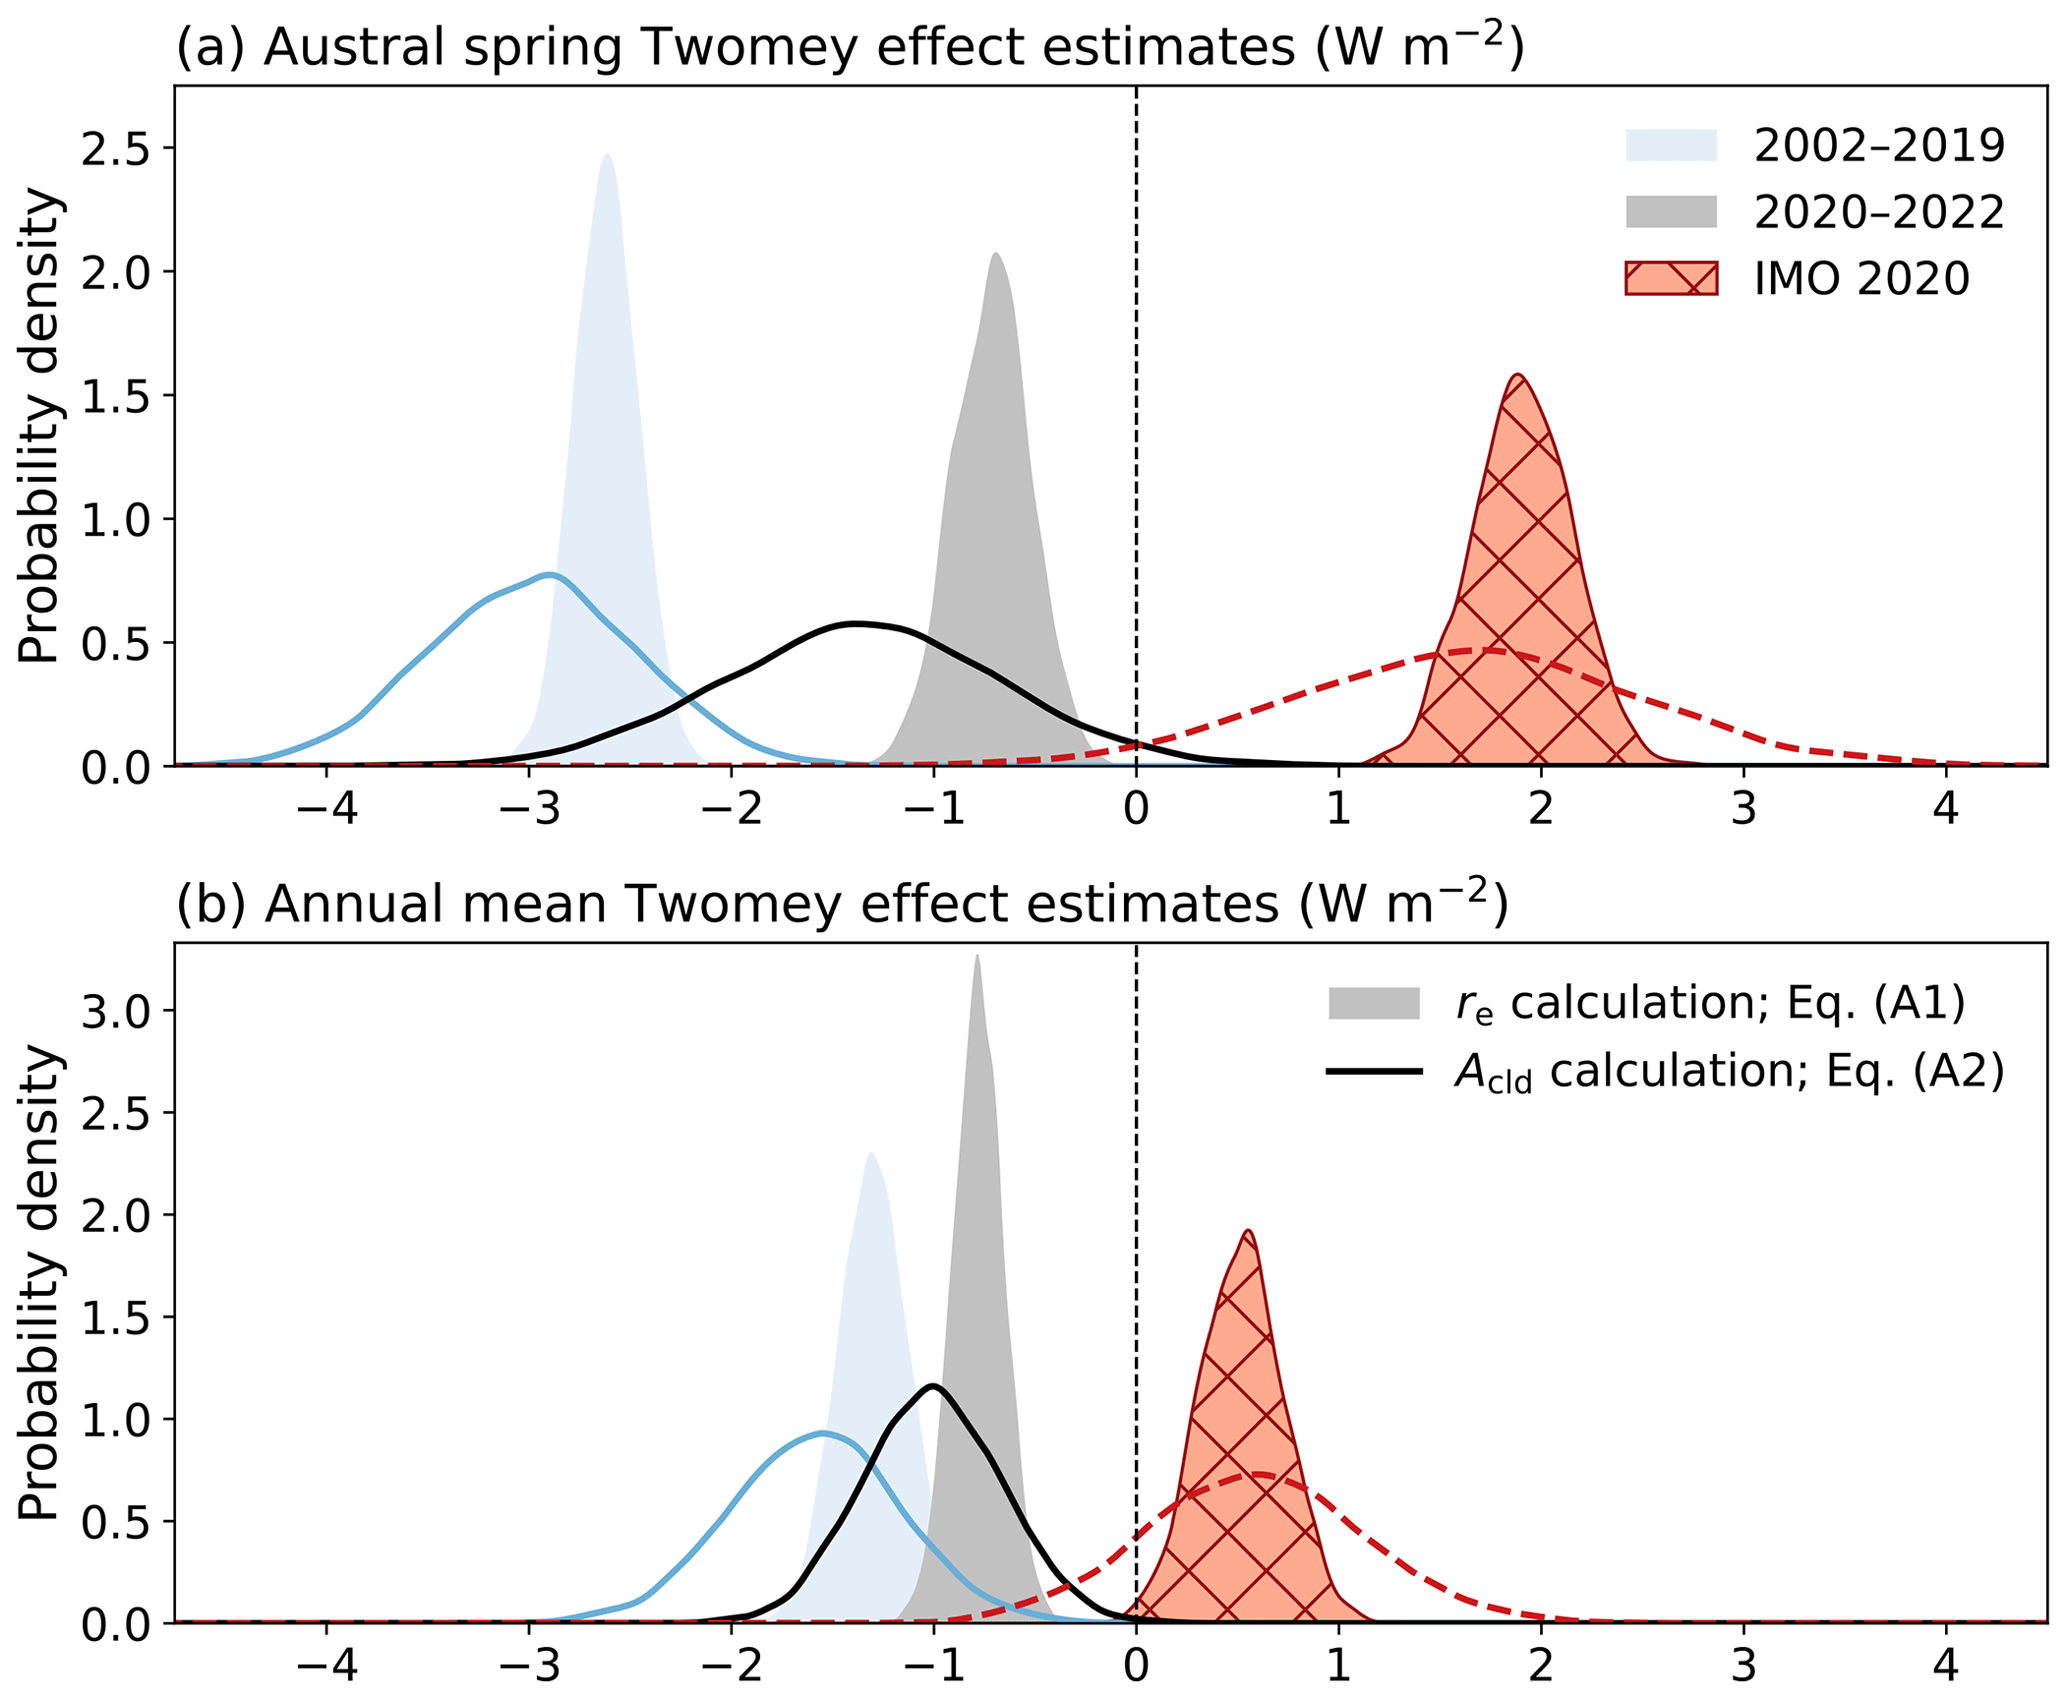
Figure 5Probability densities (via Gaussian kernel density estimation) of IRFACI for austral spring (a) and the annual mean (b) over the core shipping corridor calculated using the changes in re (shading) from Eq. (A1) and Acld (lines) from Eq. (A2) for the 2002–2019 pre-regulation climatology (solid light-blue shading and lines) and 2020–2022 post-regulation period (solid dark-gray shading and lines) due to the presence of the shipping corridor and the 2020–2022 minus climatology difference as an estimate of the effect due to implementation of the IMO 2020 regulations (patterned red shading and lines).
Source: European Geosciences Union