List of Firebug 2.0 Issues
157 views
Skip to first unread message

Glenn
Jul 24, 2014, 5:51:15 PM7/24/14
to fir...@googlegroups.com
Hey,
I've logged one bug for script-tab performances issues, but I don't have time at the moment to log all of the other problems I have. My application is quite complex, so reducing many of these into test-cases will be very time-consuming.
I understand the FF developers are working very hard as well. This is just a list of problems I've noted over the last week when trying to debug. I'll eventually log these as bugs if they don't get addressed:
Background: Iceweasel 30.0, Firebug 2.0.2.issue7560. My application uses RequireJS to load JS dynamically. All of these problems are new to FB 2.0 / FF 30:
- Adding watch items in the watch panel of the "script" section: items should be added at the top where the input box is, not appended to the bottom of the list. (e.g., add two watch expressions. second one should be above the first, but FB 2.0 appends it to bottom)
- Errors in the console have line number and a JS file. Clicking the error should highlight the line in the source. Currently it gets taken to the source page, but the line isn't marked. (Correction: sometimes it is. Sometimes it isn't. Sometimes it blinks and disappears.)
- Sometimes breakpoints in source code are triggered during the loading of the file, rather than during the line's execution. The execution stops at the bottom of the file, despite where the breakpoint is. The file appears in the scripts list, and sometimes it doesn't. This is apparently random, and hugely annoying. Using requirejs if that makes a difference.
- Sometimes when there's an error parsing javascript files, the console shows the file and the line number, but the script tab doesn't load the source, so it takes you to the main html page source instead. Ideally it will show you the file and the line. It feels like it's related to #3.
- Console messages are oddly slow. When the last line of the console is an error, sometimes it takes minutes to appear (whilst apparently doing nothing...). The print buffer of the console seems to get "lazy". This is hugely annoying when there's an error on the last line because you have to wait a long time to see where the error actual is. This might be related to the FB feature where the DOM view lags behind the animation (d3.js); that is, for a 200ms visual animation, firebug might renders the DOM changes for around half a minute. This has been around for a while, but I only noticed the laggy console after FB 2.0.
- Sometimes breakpoints stop in the wrong line. In the script view, I see the breakpoint on line 216, but it's stopping on 211 for it. (both line numbers are green (active) )
- Memory leaks. I have to restart FF / FB periodically because my memory keeps creeping up. I'll investigate whether this is my fault or not, but I never noticed this problem until FB 2.0 / FF 30
- In the scripts tab, sometimes the source file is clipped. E.g., my file is 200 lines, but only say, 43 lines are shown. Sometimes it appears later, sometimes not.
Hopefully this is of some use to the developers.
Cheers,
Glenn

stephen taylor
Jul 24, 2014, 6:26:39 PM7/24/14
to fir...@googlegroups.com
Plus one for all of this - especially 5 and 7. This is new FF 30 & FB 2. There are times without animation (both jQ and d3.js) that I do not see the DOM changes for up to 1 minute with a concomitant lag in the console. Very hard to spot errors and debug - almost unusable at times. See my earlier post on July 21. I was surpassed I was the only person seeing this, actually, as we are not doing anything all that unusual. Details in other post. I also hugely appreciate the fantastic work the FB devs do, so this is not at a critique - just hoping . . .

Sebastian Zartner
Jul 25, 2014, 3:21:32 AM7/25/14
to fir...@googlegroups.com
Hi Glenn,
thanks for reporting these issues. I'll comment on each one individually.
thanks for reporting these issues. I'll comment on each one individually.
- Adding watch items in the watch panel of the "script" section: items should be added at the top where the input box is, not appended to the bottom of the list. (e.g., add two watch expressions. second one should be above the first, but FB 2.0 appends it to bottom)
What's the reason behind that? It sounds like a personal preference to me.
- Errors in the console have line number and a JS file. Clicking the error should highlight the line in the source. Currently it gets taken to the source page, but the line isn't marked. (Correction: sometimes it is. Sometimes it isn't. Sometimes it blinks and disappears.)
I could reproduce that. Reported in issue 7607.
- Sometimes breakpoints in source code are triggered during the loading of the file, rather than during the line's execution. The execution stops at the bottom of the file, despite where the breakpoint is. The file appears in the scripts list, and sometimes it doesn't. This is apparently random, and hugely annoying. Using requirejs if that makes a difference.
I am not able to reproduce that. We need a test case for this.
- Sometimes when there's an error parsing javascript files, the console shows the file and the line number, but the script tab doesn't load the source, so it takes you to the main html page source instead. Ideally it will show you the file and the line. It feels like it's related to #3.
If a syntax error is encountered within a JavaScript file, the parser stops parsing it. Firefox doesn't provide the source code of the script in this case, so Firebug can't display it.
Allowing to display syntax errors within the Script panel is requested for in issue 2935 and I just created the platform bug 1043825 related to it.
Allowing to display syntax errors within the Script panel is requested for in issue 2935 and I just created the platform bug 1043825 related to it.
- Console messages are oddly slow. When the last line of the console is an error, sometimes it takes minutes to appear (whilst apparently doing nothing...). The print buffer of the console seems to get "lazy". This is hugely annoying when there's an error on the last line because you have to wait a long time to see where the error actual is. This might be related to the FB feature where the DOM view lags behind the animation (d3.js); that is, for a 200ms visual animation, firebug might renders the DOM changes for around half a minute. This has been around for a while, but I only noticed the laggy console after FB 2.0.
This was also reported by Stephen Tayler in another thread. Currently this can't be reproduced by us, so we need a proper test case. As I understand Stephen he also uses d3.js, so maybe it's related to that?
- Sometimes breakpoints stop in the wrong line. In the script view, I see the breakpoint on line 216, but it's stopping on 211 for it. (both line numbers are green (active) )
May be related to issue 7301. If your test case doesn't fit to what is described in there, please file a new issue and provide a test case for it.
- Memory leaks. I have to restart FF / FB periodically because my memory keeps creeping up. I'll investigate whether this is my fault or not, but I never noticed this problem until FB 2.0 / FF 30
This needs to be investigated further. A meta-issue for this is reported in issue 2601. Though if you see a memory spike on a specific action you do in Firebug, please let us know.
- In the scripts tab, sometimes the source file is clipped. E.g., my file is 200 lines, but only say, 43 lines are shown. Sometimes it appears later, sometimes not.
I didn't see that yet. Does this also happen on a fresh Firefox profile with just Firebug installed? Is it clearly reproducible or does this happen randomly?
Sebastian
Glenn
Jul 27, 2014, 5:45:49 PM7/27/14
to fir...@googlegroups.com
Hey Sebastian,
Thanks for looking at these issues. I have since downgraded both FF and FB for the time being, as I'm on a tight schedule and I find the older one is more stable/predictable at the moment.
In terms of #1: two reasons.
FB has always added watches to the top of the list (afaik), so that's what I'm used to after using it for many years now.
The logical reason as to why I think it makes sense there, is that the input field is at the top. When I have 10 watchlist items, it's weird to see my expression disappear from the input field and appear 10 lines down, between existing watch expressions and the local variables (that is, it makes it harder to find). Maybe I'll get used to it, but I'd say keep the input field next to the input field.
As for #4, the version I'm using 1.12.8 shows me the source file and line. If the browser is failing during parsing, and can tell me the exact line of code, then I should be able to see that line of code in the debugger as well. (that is, the file has been loaded already since the browser *tried* to parse it, so it is in memory somewhere.)
#5 is likely more to do with animation than with d3, in that some print / draw buffers are queuing up or something.
#6 is probably unrelated to 7301. In my case, it's not stopping on phantom breakpoints. It's stopping on breakpoints that exist. The problem is that the breakpoints are getting triggered during parsing rather than execution. This means I have to basically disable the breakpoint, reload the page, add the breakpoint after the file has been parsed (code line numbers are green). Sometimes the code never goes 'green', despite functioning correctly. I can reproduce regularly, but I can't simplify. My project has 50-100 js files being loaded via requirejs. (obviously they'll be compiled for prod).
#7 I only tend to notice after a day of dev when my memory starts to get limited. I've been trying to monitor it more closely, but haven't seen a smoking gun yet.
#8. Not a huge issue, just weird. It's like it renders part of the first page, and then forgets to draw more. Then when I scroll, the draw function kicks back into gear. It's not even very common. I might see it a couple times a day doing constant development.
Thanks for your help.

Sebastian Zartner
Aug 13, 2014, 3:54:25 AM8/13/14
to fir...@googlegroups.com
On Monday, August 11, 2014 10:27:09 PM UTC+2, Christopher Broome wrote:
I came here to report on #3 specifically. Attached a screenshot. This happens quite frequently after a page refresh.
Can you provide a test case for that, too, so this can be reproduced?
In terms of #1: two reasons.
This was mentioned again in another thread, so I said it should be reported as issue.
As for #4, the version I'm using 1.12.8 shows me the source file and line. If the browser is failing during parsing, and can tell me the exact line of code, then I should be able to see that line of code in the debugger as well. (that is, the file has been loaded already since the browser *tried* to parse it, so it is in memory somewhere.)
Exactly. Though the info about the position within the code comes from Firefox APIs, not from Firebug itself, though we currently don't get the source itself through these APIs at the moment. That's why I created bug 1043825.
#5 is likely more to do with animation than with d3, in that some print / draw buffers are queuing up or something.
This still needs some test case, so it can be reproduced.
#6 is probably unrelated to 7301. In my case, it's not stopping on phantom breakpoints. It's stopping on breakpoints that exist. The problem is that the breakpoints are getting triggered during parsing rather than execution. This means I have to basically disable the breakpoint, reload the page, add the breakpoint after the file has been parsed (code line numbers are green). Sometimes the code never goes 'green', despite functioning correctly. I can reproduce regularly, but I can't simplify. My project has 50-100 js files being loaded via requirejs. (obviously they'll be compiled for prod).
Let me clarify how the marking of lines as executable works. Lines,
which are in the global scope will just be executed once, so they will not be marked as executable once the page is loaded. See the following screenshot for an illustration.
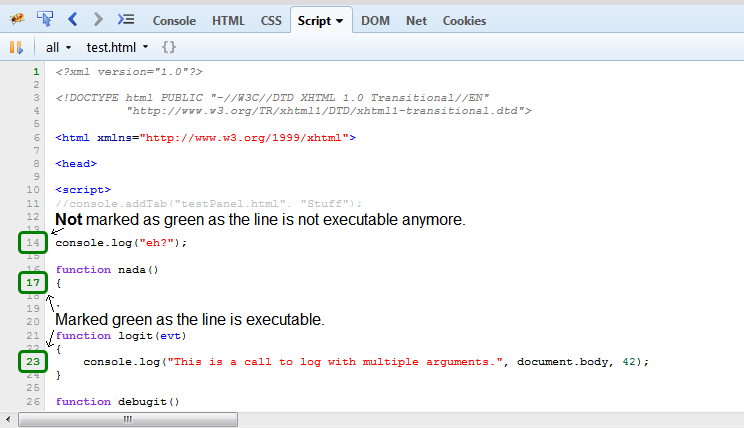
If you set a breakpoint at line 14, you'll see that it get's marked in green and hit when you reload the page.
To get back to your statement about breakpoints being hit while the code is parsed: So this means you have a breakpoint within a function, which isn't executed yet, though the breakpoint is hit? What do you see inside the Stack side panel then?
Sebastian
Glenn
Aug 13, 2014, 6:49:15 PM8/13/14
to fir...@googlegroups.com
#6:
Using your example, assume there is no "debugit" function and the script block is closed after the login function definition (to simplify things).
What I'm describing is that I but a breakpoint on line 23. When I reload the page, that breakpoint would be hit in the global execution and stop somewhere like line 24 or 26. So I have to disable the L23 breakpoint, reload the page, and then reapply it.
Files where this happens have the form (requirejs style):
define([],function() {
function a() {
someFunc();
}
});
So, a breakpoint on "someFunc()" line will stop on the closing line " }); " when the page is reloaded.
Cheers!
--
You received this message because you are subscribed to a topic in the Google Groups "Firebug" group.
To unsubscribe from this topic, visit https://groups.google.com/d/topic/firebug/J1s4ZApnp-s/unsubscribe.
To unsubscribe from this group and all its topics, send an email to firebug+u...@googlegroups.com.
To post to this group, send email to fir...@googlegroups.com.
Visit this group at http://groups.google.com/group/firebug.
To view this discussion on the web visit https://groups.google.com/d/msgid/firebug/615ffffb-52a4-4dd9-b8c0-fbf5729cd511%40googlegroups.com.
For more options, visit https://groups.google.com/d/optout.
Christopher Broome
Aug 14, 2014, 9:15:45 AM8/14/14
to fir...@googlegroups.com
I'll try to whip up something publicly accessible. In the interim, I'll just add that like Glenn my project uses requirejs and is quite large, with hundreds of files in its development version.
Reply all
Reply to author
Forward
0 new messages