Suggestions for Firebug gaps to be closed by the DevTools
1,319 views
Skip to first unread message

Sebastian Zartner
Apr 27, 2016, 8:06:17 AM4/27/16
to Firebug
The Firefox DevTools team is working on closing the gaps between their tools and Firebug.
In the first quarter of the year the Firebug theme, HTTP log inspection in the Console panel and the DOM panel were ported to Firefox (see bug 1256749).
Now the team is asking what should be fixed in Q2 2016. See bug 1267303.
My suggestions:
Sebastian
In the first quarter of the year the Firebug theme, HTTP log inspection in the Console panel and the DOM panel were ported to Firefox (see bug 1256749).
Now the team is asking what should be fixed in Q2 2016. See bug 1267303.
My suggestions:
- 1004678: Break on DOM mutation
- 1267144: Allow to set breakpoints for XHRs
- 1165010: Set a breakpoint for errors in WebConsole (like Firebug)
- 1226640: Add Events side panel
- 1227054: [rule view] Show whether a CSS property, value or selector is valid
- 1267140: Allow auto-completing non-enumerable properties and member functions return types of known types
Sebastian
Sebastian Zartner
May 4, 2016, 3:47:33 AM5/4/16
to Firebug
Here's another feature I'd like to see implemented:
1270015: Smarter suggestions for DOM properties
Sebastian
1270015: Smarter suggestions for DOM properties
Sebastian

Lawrence San
May 4, 2016, 12:42:44 PM5/4/16
to fir...@googlegroups.com
Sebastian, your suggestions sound excellent. I'd like to add just one of my own, which I've made before, but only here since I don't have an account on bugzilla...
I'll make up a name for it: Live code mapping.
Add some way to reverse-map from the current URL in Firefox, to the corresponding actual source file on the development server. Right now all the Firefox/Firebug "view source" options are just variations on showing the browser's downloaded, cached duplicate. I like to open the actual, original, server file for real, just by clicking something or using a keyboard shortcut at the client end.
Of course this is only possible for someone who has read/write permissions on that server, but most of us do, for the sites we're building. In my case, the "server" is actually local (I'm using MAMP, which is the Mac equivalent of XAMPP on Windows, etc.), but it shouldn't matter whether it's a local development server or up on the Internet somewhere.
Right now I can only accomplish this using a separate Firefox extension called Dafizilla View Source With. But it's not under very active development, and I doubt if it has even been updated for E10s. However -- the fact that it does work (for now) means this is possible, so why can't Firebug do this on its own?
I've only used the Chrome dev tools a little, but someone online thought they have this live-mapping ability that I'm talking about... actually he thought it might be broken now, but wasn't sure.
It's hard to explain to people who haven't used this technique, how useful it is. My workflow is based on browsing through the website I'm building, in Firefox, and when I see something that needs editing (content or code), I click one button in the Firefox toolbar and the actual server page pops up in my code editor (in my case, BBEdit on the Mac, or Notepad++ in Windows). If I edit the code there and Save, I'm updating it for real. This is incredibly convenient!
Can't this be implemented in Firebug?

Erik Krause
May 4, 2016, 5:43:50 PM5/4/16
to fir...@googlegroups.com
Am 04.05.2016 um 18:41 schrieb Lawrence San:
> My workflow is based on browsing through the website I'm building,
> in Firefox, and when I see something that needs editing (content or code),
> I click one button in the Firefox toolbar and the actual server page pops
> up in my code editor (in my case, BBEdit on the Mac, or Notepad++ in
> Windows). If I edit the code there and Save, I'm updating it*for real*.
> My workflow is based on browsing through the website I'm building,
> in Firefox, and when I see something that needs editing (content or code),
> I click one button in the Firefox toolbar and the actual server page pops
> up in my code editor (in my case, BBEdit on the Mac, or Notepad++ in
This would be very nice indeed. And it might run for static pages. But
as soon as some server side language is involved (like PHP, JSP, ASP
etc.) the only way to do that would be to provide a source map. This
should already work in the firefox dev tools (and hence for
firebug.next) for JS and CSS. But I don't have any clue whether this
would be possible for server side languages as well...
--
Erik Krause
http://www.erik-krause.de
Lawrence San
May 5, 2016, 1:51:18 AM5/5/16
to fir...@googlegroups.com
Erik, I believe there is some facility in the extension I'm using (Dafizilla ViewSourceWith) to map to server scripts as well -- as you say, to define a "source map" -- but I'm not sure because I don't bother with it.
All I want is for the main, core HTML file (corresponding to what I'm looking at in Firefox) to pop up in my code editor. It makes no difference whether the page is completely static (rare) or has PHP server code that partially generates the "final" HTML -- if I wanted to see the final composited result, I'd ask to see the browser's own generated/cached source in one of the usual ways. What I'm getting with my approach is just the master HTML file from the server; that's all I want. If there are (for example) calls to PHP in there, they show up as calls to PHP, not as the result. This is complementary to seeing the final/generated code that the browser uses and can show you; it doesn't replace that other meaning of "viewing the source."
All I want is for the main, core HTML file (corresponding to what I'm looking at in Firefox) to pop up in my code editor. It makes no difference whether the page is completely static (rare) or has PHP server code that partially generates the "final" HTML -- if I wanted to see the final composited result, I'd ask to see the browser's own generated/cached source in one of the usual ways. What I'm getting with my approach is just the master HTML file from the server; that's all I want. If there are (for example) calls to PHP in there, they show up as calls to PHP, not as the result. This is complementary to seeing the final/generated code that the browser uses and can show you; it doesn't replace that other meaning of "viewing the source."
In fact, I haven't even bothered figuring out how the ViewSourceWith extension handles other client languages (i.e, CSS and JS) -- although I know it can -- because my main code editor (BBEdit) has its own popdown menu showing me all the CSS, JS, PHP, etc. that is linked to that page, and I use that menu to access the resources associated with the current HTML file, as needed.
As I said, I really wish that Firebug could add this live-mapping feature, so I wouldn't be dependent on another tool to do this.

alfonsoml
May 5, 2016, 11:59:00 AM5/5/16
to Firebug
It seems that you want this:
https://developers.google.com/web/tools/setup/setup-workflow
Even if it doesn't match exactly what you want, it's a thousands times closer to anything that Firebug offers
one day you'll ask yourself why you have been focused for so long only on Firebug instead of looking at other options.
https://developers.google.com/web/tools/setup/setup-workflow
Even if it doesn't match exactly what you want, it's a thousands times closer to anything that Firebug offers
one day you'll ask yourself why you have been focused for so long only on Firebug instead of looking at other options.
Sebastian Zartner
May 5, 2016, 5:04:57 PM5/5/16
to Firebug
Hi Lawrence, hi Alfonso!
Lawrence, yes, being able to create mappings between the content shown in the browser and the related resources on the server is a good idea.
As Alfonso mentioned, the Firefox DevTools already have a feature that goes into that direction, which is called source maps.
Firebug has a feature that allows you to open the HTML, CSS or JavaScript in an external editor, though only the contents you're seeing inside the browser. It doesn't offer any mapping to the server sources.
Therefore your suggestion would be nice as enhancement request for the Firefox DevTools, though it fails my request for features which Firebug has and the DevTools should implement to close the gaps between both tools.
Sebastian
Lawrence San
May 5, 2016, 6:03:15 PM5/5/16
to fir...@googlegroups.com
As Alfonso mentioned, the Firefox DevTools already have a feature that goes into that direction...
Sebastian, the link Alfonso supplied doesn't refer to the Firefox dev tools, it involves the Chrome dev tools. And it seems a little closer to what I'm talking about than your link does, although I'm not sure... I think they expect you to do the editing in their dev environment, not in your own text editor as I prefer. I only looked briefly at the Moz page you linked to, but from the introduction, it seems to refer only to finding the original JavaScript sources of compiled JavaScripts.
I'm interested in mapping the current browser-rendered page to its main HTML server page, and then opening that HTML in my text editor, nothing more. Nothing fancy.
This is so important to me (the way I work) that if a newer version of Firefox breaks the extension I'm using, I'll stop upgrading Firefox and stick with the old version. If Firefox could be scripted with AppleScript, I might be able to figure out a way to do the mapping there... but AFAIK Mac Firefox isn't AppleScript-able.
I like the Firefox/Firebug devel interface better than Chrome's (I guess I'm just more used to it), but Chrome is much more successful at rendering a wide range of pages for ordinary browsing... so I could see a situation where I end up developing in an old version of Firefox, but doing routine browsing in a current version of Chrome. Which sounds a little awkward. That's what I'm hoping to avoid.
I like the Firefox/Firebug devel interface better than Chrome's (I guess I'm just more used to it), but Chrome is much more successful at rendering a wide range of pages for ordinary browsing... so I could see a situation where I end up developing in an old version of Firefox, but doing routine browsing in a current version of Chrome. Which sounds a little awkward. That's what I'm hoping to avoid.
Sebastian Zartner
May 6, 2016, 2:36:06 AM5/6/16
to Firebug
On Friday, May 6, 2016 at 12:03:15 AM UTC+2, San wrote:
As Alfonso mentioned, the Firefox DevTools already have a feature that goes into that direction...
Sebastian, the link Alfonso supplied doesn't refer to the Firefox dev tools, it involves the Chrome dev tools.
My mistake. It was Erik that mentioned them. Though, as far as I know, the dev tools of all major browsers support source maps, probably even the ones from Edge, though I can't test that at the moment.
And it seems a little closer to what I'm talking about than your link does, although I'm not sure... I think they expect you to do the editing in their dev environment, not in your own text editor as I prefer. I only looked briefly at the Moz page you linked to, but from the introduction, it seems to refer only to finding the original JavaScript sources of compiled JavaScripts.
Yes, that's it. It doesn't work with external editors, it only allows you to debug the original sources within their tools instead of the compiled ones and that only works with CSS and JavaScript. Sorry for not being clear about that before!
I'm interested in mapping the current browser-rendered page to its main HTML server page, and then opening that HTML in my text editor, nothing more. Nothing fancy.
In case the HTML is dynamically generated, there is no main HTML server page, it will be some server-side script.
This is so important to me (the way I work) that if a newer version of Firefox breaks the extension I'm using, I'll stop upgrading Firefox and stick with the old version. If Firefox could be scripted with AppleScript, I might be able to figure out a way to do the mapping there... but AFAIK Mac Firefox isn't AppleScript-able.
I like the Firefox/Firebug devel interface better than Chrome's (I guess I'm just more used to it), but Chrome is much more successful at rendering a wide range of pages for ordinary browsing... so I could see a situation where I end up developing in an old version of Firefox, but doing routine browsing in a current version of Chrome. Which sounds a little awkward. That's what I'm hoping to avoid.
Again, I can fully understand your request and I'd really like to have that feature, though it doesn't fit to the topic of this thread.
I found bug 1026674 now, which targets live editing the source files within Firefox's WebIDE. And I've now created bug 1270733 for opening the files in an external editor. If you want to follow these reports or comment on them, you need to create a Bugzilla account.
Sebastian

Qlum Wyrfex
Jul 22, 2016, 5:24:42 AM7/22/16
to Firebug
I find the auto completion in firebug much better then the one in the native debugger.
For example when creating a new property in css if you type "b" the native debugger will suggest "backface-visibility" which is something I personally never even knew existed where firebug would suggest "background" which is much more commonly used.
The native dev tools just seem to suggest them alphabetically.
Sebastian Zartner
Jul 22, 2016, 8:37:08 AM7/22/16
to fir...@googlegroups.com
You're lucky. The suggestions already improved in Firefox 48. See https://developer.mozilla.org/en-US/docs/Tools/Page_Inspector/How_to/Examine_and_edit_CSS#Edit_rules and https://bugzil.la/1168246.
So, to everyone wanting to post to this thread, please check the latest Firefox Nightly before suggesting something here.
--
You received this message because you are subscribed to the Google Groups "Firebug" group.
To unsubscribe from this group and stop receiving emails from it, send an email to firebug+u...@googlegroups.com.
To post to this group, send email to fir...@googlegroups.com.
Visit this group at https://groups.google.com/group/firebug.
To view this discussion on the web visit https://groups.google.com/d/msgid/firebug/7f8ce879-6d3d-4187-8592-5b919c72ff0f%40googlegroups.com.

Mahks Doma
Sep 28, 2016, 8:32:25 PM9/28/16
to fir...@googlegroups.com
see bug 1306160 at bugzilla
On 13 September 2016 at 07:17, Mahks Doma <mah...@gmail.com> wrote:
The firebug method of having the list as a tab was much much better.This opens a horizontal panel across the bottom containing both the console & the DOM properties.In Firebug under HTML the was a DOM tabCurrently in dev tools under inspector, one must use the context menu to select "Show DOM properties".
Are there plans to have that (very useful) option in dev tools?
This is a real pain. The console is not needed when viewing the DOM properties and having the property list down there requires excessive scrolling or resizing of panels.
On 22 July 2016 at 19:36, Sebastian Zartner <sebastia...@gmail.com> wrote:
You're lucky. The suggestions already improved in Firefox 48. See https://developer.mozilla.org/en-US/docs/Tools/Page_Inspector/How_to/Examine_and_edit_CSS#Edit_rules and https://bugzil.la/1168246.So, to everyone wanting to post to this thread, please check the latest Firefox Nightly before suggesting something here.Sebastian
On 22 July 2016 at 11:12, Qlum Wyrfex <qlu...@gmail.com> wrote:
I find the auto completion in firebug much better then the one in the native debugger.
For example when creating a new property in css if you type "b" the native debugger will suggest "backface-visibility" which is something I personally never even knew existed where firebug would suggest "background" which is much more commonly used.
The native dev tools just seem to suggest them alphabetically.
--
You received this message because you are subscribed to the Google Groups "Firebug" group.
To unsubscribe from this group and stop receiving emails from it, send an email to firebug+unsubscribe@googlegroups.com.
To post to this group, send email to fir...@googlegroups.com.
Visit this group at https://groups.google.com/group/firebug.
To view this discussion on the web visit https://groups.google.com/d/msgid/firebug/7f8ce879-6d3d-4187-8592-5b919c72ff0f%40googlegroups.com.
--
You received this message because you are subscribed to the Google Groups "Firebug" group.
To unsubscribe from this group and stop receiving emails from it, send an email to firebug+unsubscribe@googlegroups.com.
To post to this group, send email to fir...@googlegroups.com.
Visit this group at https://groups.google.com/group/firebug.
To view this discussion on the web visit https://groups.google.com/d/msgid/firebug/CAERejNYw5%2BvPtXF09NNVs_oYPhc2je_4%3DBOoF3rBBa6_4PD2JA%40mail.gmail.com.
Sebastian Zartner
Sep 29, 2016, 8:19:02 AM9/29/16
to Firebug
On Thursday, September 29, 2016 at 2:32:25 AM UTC+2, Mahks wrote:
see bug 1306160 at bugzilla
On 13 September 2016 at 07:17, Mahks Doma <mah...@gmail.com> wrote:
The firebug method of having the list as a tab was much much better.This opens a horizontal panel across the bottom containing both the console & the DOM properties.In Firebug under HTML the was a DOM tabCurrently in dev tools under inspector, one must use the context menu to select "Show DOM properties".
Are there plans to have that (very useful) option in dev tools?
This is a real pain. The console is not needed when viewing the DOM properties and having the property list down there requires excessive scrolling or resizing of panels.
On 22 July 2016 at 19:36, Sebastian Zartner <sebastia...@gmail.com> wrote:
You're lucky. The suggestions already improved in Firefox 48. See https://developer.mozilla.org/en-US/docs/Tools/Page_Inspector/How_to/Examine_and_edit_CSS#Edit_rules and https://bugzil.la/1168246.So, to everyone wanting to post to this thread, please check the latest Firefox Nightly before suggesting something here.Sebastian
On 22 July 2016 at 11:12, Qlum Wyrfex <qlu...@gmail.com> wrote:
I find the auto completion in firebug much better then the one in the native debugger.
For example when creating a new property in css if you type "b" the native debugger will suggest "backface-visibility" which is something I personally never even knew existed where firebug would suggest "background" which is much more commonly used.
The native dev tools just seem to suggest them alphabetically.
--
You received this message because you are subscribed to the Google Groups "Firebug" group.
To unsubscribe from this group and stop receiving emails from it, send an email to firebug+u...@googlegroups.com.
To post to this group, send email to fir...@googlegroups.com.
Visit this group at https://groups.google.com/group/firebug.
To view this discussion on the web visit https://groups.google.com/d/msgid/firebug/7f8ce879-6d3d-4187-8592-5b919c72ff0f%40googlegroups.com.
--
You received this message because you are subscribed to the Google Groups "Firebug" group.
To unsubscribe from this group and stop receiving emails from it, send an email to firebug+u...@googlegroups.com.
To post to this group, send email to fir...@googlegroups.com.
Visit this group at https://groups.google.com/group/firebug.
Sebastian Zartner
Nov 22, 2016, 7:59:31 AM11/22/16
to Firebug
As requested in bug 991806 I am asking again for any Firebug features you are missing in the Firefox DevTools or which are not working as good as in Firebug.
Please let us know the most pressing things you're missing!
Sebastian
PS: Be constructive and polite!
Please let us know the most pressing things you're missing!
Sebastian
PS: Be constructive and polite!
Erik Krause
Nov 22, 2016, 9:38:42 AM11/22/16
to fir...@googlegroups.com
Am 22.11.2016 um 13:59 schrieb Sebastian Zartner:
> Please let us know the most pressing things you're missing!
Shall we add things even if there is already a bug on bugzilla?
> Please let us know the most pressing things you're missing!
For me this would be Add cookie function.
--
Erik Krause
Lawrence San
Nov 22, 2016, 10:00:03 AM11/22/16
to fir...@googlegroups.com
I suggest showing normal log text in black, and warnings in red, rather than the other way around.
Also the ability to configure the type styles (size, color, even font) would be nice.
Also if anything could be done to help the FirePHP developer get it working again...
Erik Krause
Nov 22, 2016, 10:06:40 AM11/22/16
to fir...@googlegroups.com
Am 22.11.2016 um 15:59 schrieb Lawrence San:
> Also if anything could be done to help the FirePHP developer get it working
> again...
I wrote to him directly and he answered that it is in active development
> Also if anything could be done to help the FirePHP developer get it working
> again...
and pointed me to
https://github.com/firephp/firephp-for-firefox-devtools
However, nothing happened since. Since devtools support ChromeLogger
natively I think about writing a wrapper for ChromeLogger which provides
FirePHP syntax.
--
Erik Krause
Lawrence San
Nov 22, 2016, 4:54:20 PM11/22/16
to fir...@googlegroups.com
Erik Krause said:
Since devtools support ChromeLogger natively I think about writing a wrapper for ChromeLogger which provides FirePHP syntax.
Thanks, that sounds useful.
In the meantime, here's an entire thread on StackOverflow about generic ways to send PHP to a browser console. I've been able to adapt a simple PHP function from the examples shown there.
Erik Krause
Nov 22, 2016, 6:18:12 PM11/22/16
to fir...@googlegroups.com
Am 22.11.2016 um 22:53 schrieb Lawrence San:
>> Since devtools support ChromeLogger natively I think about writing a
>> wrapper for ChromeLogger which provides FirePHP syntax.
>>
> Thanks, that sounds useful.
I've looked into it but unfortunately I'm pretty unfamiliar with PHP
>> Since devtools support ChromeLogger natively I think about writing a
>> wrapper for ChromeLogger which provides FirePHP syntax.
>>
> Thanks, that sounds useful.
object syntax and functionality. No luck so far. If someone else would
do it I'd be very grateful.
Meanwhile ChromeLogger provides almost the same interface, only that
$Label and $Object is in opposite order than in FirePHP. Unfortunately
setEnabled is missing from ChromePhp...
Sebastian Zartner
Nov 22, 2016, 6:38:05 PM11/22/16
to Firebug
On Tuesday, November 22, 2016 at 3:38:42 PM UTC+1, Erik Krause wrote:
Am 22.11.2016 um 13:59 schrieb Sebastian Zartner:
> Please let us know the most pressing things you're missing!
Shall we add things even if there is already a bug on bugzilla?
Yes, of course! The point of this thread is to tell the DevTools people what the Firebug users are missing most, so they can do some prioritization. If you know the bug number, please share it here.
For me this would be Add cookie function.
On Tuesday, November 22, 2016 at 4:00:03 PM UTC+1, San wrote:
I suggest showing normal log text in black, and warnings in red, rather than the other way around.
Also the ability to configure the type styles (size, color, even font) would be nice.
Sounds good, though Firebug didn't provide that feature. Let's keep the discussion at the Firebug features missing or not working as expected in the DevTools. You may want to file a new bug on Bugzilla for this feature, though.
Also if anything could be done to help the FirePHP developer get it working again...
As mentioned by Erik, logging server messages from PHP and other languages is already implemented. See https://developer.mozilla.org/en-US/docs/Tools/Web_Console/Console_messages#Server. I didn't try it myself yet, so I can't help with this.
For further information on how this works, please contact the DevTools team. Again, please constrain this thread to Firebug gaps.
Sebastian

teo venier
Nov 24, 2016, 2:42:30 AM11/24/16
to Firebug
I know that there is already bug 704094, but I have not seen any comment about the lack of the DOM tab inside the Inspect Element panel, along with the tabs: rules, computed, animations and so on.
So I decided to post this message to remind them of this feature.
PS: Sorry my english.
So I decided to post this message to remind them of this feature.
PS: Sorry my english.

Matthew McRae
Nov 24, 2016, 2:42:32 AM11/24/16
to Firebug
One thing that seems to be missing is the autocomplete when making CSS changes.
When I would begin typing a CSS rule - Firebug would auto complete it depending on the page I was on (E.G. On Wordpress, it was able to detect the fill in the page-id)
Now it doesn't complete at all - making it more cumbersome.
I have to say I HATE the Firefox dev tools, they are shite compared to Firebug. Please bring Firebug back, sir.

Denis Chenu
Nov 24, 2016, 7:50:57 AM11/24/16
to Firebug
Hi,
I start vote for some feature in bugzilla. But currently, my big issue is the speed difference between Firbug VS DevTool in DOM Inspector.
With Firebug, it take me less than 1/2 second to select an element in DOM and review classname/id etc ....
With DevTool : it's really more slow, i think it's due (in part) by the updated windows : show padding/margin/horizont bar/vertical bar/tooltip with information.
I think we need all this part only after click on element (or if select element via the inspector, but not via the HTML window).
Hope you understand what i mean :)
Thanks,
Denis
Sebastian Zartner
Nov 24, 2016, 4:53:19 PM11/24/16
to Firebug
On Thursday, November 24, 2016 at 8:42:30 AM UTC+1, teo venier wrote:
I know that there is already bug 704094, but I have not seen any comment about the lack of the DOM tab inside the Inspect Element panel, along with the tabs: rules, computed, animations and so on.
So I decided to post this message to remind them of this feature.
Good point! The bug was obviously assigned to someone a month ago, so hopefully that will be implemented soon.
Though note you can actually already inspect the DOM properties of the selected element in the current versions of the DevTools - though with a suboptimal UI.
To do that, right-click the element and choose Show DOM Properties from the context menu.
PS: Sorry my english.
Your English is perfectly readable. (Though I'm also not a native English speaker. :-) )
On Thursday, November 24, 2016 at 8:42:32 AM UTC+1, Matthew McRae wrote:
One thing that seems to be missing is the autocomplete when making CSS changes.
When I would begin typing a CSS rule - Firebug would auto complete it depending on the page I was on (E.G. On Wordpress, it was able to detect the fill in the page-id)
Now it doesn't complete at all - making it more cumbersome.
Oh yes! That is really, really annoying! I wonder why I forgot to mention that so far. I could have sworn I already filed bugs related to that, though I can't find any. :-/
So, I'll file them now and put this on the list.
I remember this was fixed for one or two properties in the past, but it requires to be fixed for each property individually.
I have to say I HATE the Firefox dev tools, they are shite compared to Firebug. Please bring Firebug back, sir.
That won't happen - at least not as long as nobody stands up to revive the Firebug project.
I guess you mean that it takes longer until the display of the Inspector panel updated, right?
Though, because you mention DOM, there is also a DOM panel, which is really slow. Though that slowness is already tracked in bug 1264908.
Having said that, the display of the DevTools is generally a bit slow. I assume this is due to the asynchronous structure of their UI. And I agree that this needs to be improved, though I wonder if that can be seen as "Firebug gap".
Sebastian
Denis Chenu
Nov 25, 2016, 3:48:40 AM11/25/16
to Firebug
Hi,
You're right : inspector is really slow :)
Maybe remive 'live update' of CSS can improve speed .
Denis
You're right : inspector is really slow :)
Maybe remive 'live update' of CSS can improve speed .
Denis

Nick Roosevelt
Nov 28, 2016, 12:52:19 PM11/28/16
to Firebug
I am dearly missing the feature that displayed json in a cookie in a nice format.

Gregor Gonzalez
Nov 28, 2016, 12:52:19 PM11/28/16
to Firebug
I don't know if i should public this here, sorry. (i'm not an english speaker)
So... I updated my firefox today and they take away my precious firebug. Now it's part of firefox?
I never used the devtools, firebug was more simple and fast, helpedme so many times. Now is gone and I have to struggle with my daily work.
I know I can simply adapt and continue, I like to learn new things and also like when technolgy improves. I know firebug has his own problems, most of the time I had to turn it off because was slowing the browser, or restart because wasn't working well.
But firebug was more of what I need, so fast compared with the problems I face right now.
Example:
Before:
Now:
I'm worried because this changes can affects the way that I work, making me slower... for now jeje
Just a story that I needed to tell. Thanks! I'll try now with ajax javascript and messing more with css. Wish me luck u.u
So... I updated my firefox today and they take away my precious firebug. Now it's part of firefox?
I never used the devtools, firebug was more simple and fast, helpedme so many times. Now is gone and I have to struggle with my daily work.
I know I can simply adapt and continue, I like to learn new things and also like when technolgy improves. I know firebug has his own problems, most of the time I had to turn it off because was slowing the browser, or restart because wasn't working well.
But firebug was more of what I need, so fast compared with the problems I face right now.
- Now the inspector is a pain, sometimes doesn't work to choose an element, sometimes choose the element but only for 5 seconds and I have to search for it again.
- "Right click inspect with firebug" sometimes works, some times don't, sometimes show you the "body" and not the element you choosed.
- Adding tags, atributes, css, is more complicated and doesn't show live.
Example:
Before:
- Right click -> inspect -> I write.
Now:
- Right click -> inspect (doesn't work)
- Right click -> inspect (Worked but does not show the element I choseed)
- Right click -> inspect (woked fine this time)
- I choose the elment to edit (cannot edit)
- Chose the atribute (cannot edit)
- Chose the element again and "right click -> edit element"
- Show the entire node, search for the element inside.
- I write to edit the element (nothing happens)
- Pressed enter (just create a new line)
- Deleted the line and re-write the atribute (because it created so many gaps and you have to clean manually)
- Enter doesn't work, so how you do: "ok make the changes"? I click there (doesn't work), click on the page (doesn't work), click on the screen or menu (doesn't work).
- You have to click between the gap of the menu but above the code you wrote.
I'm worried because this changes can affects the way that I work, making me slower... for now jeje
Just a story that I needed to tell. Thanks! I'll try now with ajax javascript and messing more with css. Wish me luck u.u

joschka...@gmail.com
Nov 28, 2016, 12:52:20 PM11/28/16
to Firebug
I would rather see some small improvements like:
and so on...
I think that these suggestions are not so hard to implement, aren't they? Please correct me if I'm wrong!
- Jumping from one value to another in the BOX Model view (like in Firebug!)
- A real good syntax highlighting theme coz the new syntax highlighting is really bad (yes I know I now have my own chrome.css)
- Support copying the whole - absolute - CSS Selector path and not only the relative path (like in Firebug!)
- A simple shortcut for the eyedropper
and so on...
I think that these suggestions are not so hard to implement, aren't they? Please correct me if I'm wrong!
Sebastian Zartner
Dec 1, 2016, 10:49:10 AM12/1/16
to Firebug
On Monday, November 28, 2016 at 6:52:19 PM UTC+1, Nick Roosevelt wrote:
I am dearly missing the feature that displayed json in a cookie in a nice format.
That's already available, just displayed a bit differently than in Firebug:

On Monday, November 28, 2016 at 6:52:19 PM UTC+1, Gregor Gonzalez wrote:
But firebug was more of what I need, so fast compared with the problems I face right now.
- Now the inspector is a pain, sometimes doesn't work to choose an element, sometimes choose the element but only for 5 seconds and I have to search for it again.
That sounds like a bug. You should file it with a reproducible test case.
- "Right click inspect with firebug" sometimes works, some times don't, sometimes show you the "body" and not the element you choosed.
The DevTools are slower than Firebug in this regard. (On my slow laptop this can take up to 5 to 10 seconds!) First the <body> element is selected, but later the inspected element is selected. Performance really needs to be improved.
- Adding tags, atributes, css, is more complicated and doesn't show live.
Now:
- Right click -> inspect (doesn't work)
- Right click -> inspect (Worked but does not show the element I choseed)
If it's reproducible, please file a bug.
- Right click -> inspect (woked fine this time)
- I choose the elment to edit (cannot edit)
- Chose the atribute (cannot edit)
Editing works by double-clicking (while in Firebug it works with a single click).
- Chose the element again and "right click -> edit element"
- Show the entire node, search for the element inside.
- I write to edit the element (nothing happens)
- Pressed enter (just create a new line)
- Deleted the line and re-write the atribute (because it created so many gaps and you have to clean manually)
- Enter doesn't work, so how you do: "ok make the changes"? I click there (doesn't work), click on the page (doesn't work), click on the screen or menu (doesn't work).
You need to press Ctrl+Enter or F2.
On Monday, November 28, 2016 at 6:52:20 PM UTC+1, joschka...@gmail.com wrote:
I would rather see some small improvements like:
- Jumping from one value to another in the BOX Model view (like in Firebug!)
Good UX suggestion! That should be covered by bug 1243045.
- A real good syntax highlighting theme coz the new syntax highlighting is really bad (yes I know I now have my own chrome.css)
If you have precise suggestions, you should report them.
- Support copying the whole - absolute - CSS Selector path and not only the relative path (like in Firebug!)
Like above, you should report a bug for it. Personally, I can't remember when I ever needed this option, so you should provide a good use case when filing it.
- A simple shortcut for the eyedropper
Good point. That's bug 1177108. (Though that's unrelated to Firebug.)
and so on...
I think that these suggestions are not so hard to implement, aren't they? Please correct me if I'm wrong!
They do sound like easy things to implement. That said, I am not part of the DevTools team, so I can only forward suggestions. But I know that they welcome anyone who wants to contribute some code.
Sebastian
Erik Krause
Dec 3, 2016, 6:44:17 AM12/3/16
to fir...@googlegroups.com
Am 23.11.2016 um 00:18 schrieb Erik Krause:
> Meanwhile ChromeLogger provides almost the same interface, only that
> $Label and $Object is in opposite order than in FirePHP. Unfortunately
> setEnabled is missing from ChromePhp...
Well, I've modified ChromePHP, added global enable / disable and changed
> Meanwhile ChromeLogger provides almost the same interface, only that
> $Label and $Object is in opposite order than in FirePHP. Unfortunately
> setEnabled is missing from ChromePhp...
the arguments order to be compatible with FirePHP. This functionality
must be switched on, so ChromePHP original functionality is not
toouched. PM me if you want it...

Giannis Koutsaftakis
Dec 4, 2016, 11:52:11 PM12/4/16
to Firebug
One of the best features of firebug was the ability to show consoled.logged js objects in the DOM pane.
You just clicked and the object expanded right there in the DOM pane.
Another issue is the colors, but I think this was mentioned before.
You just clicked and the object expanded right there in the DOM pane.
Another issue is the colors, but I think this was mentioned before.
joschka...@gmail.com
Dec 5, 2016, 7:28:21 AM12/5/16
to Firebug
Hi Sebastian,
I have now filed the bug with the absolute path here: https://bugzilla.mozilla.org/show_bug.cgi?id=1322116
Hope that some one really understand the problem?
To my other suggestions:
The Box Model navigation bug is well known like you said: https://bugzilla.mozilla.org/show_bug.cgi?id=1243045
But what I also see is the fact that it's now almost one year old and for me it seems that there is a solution: https://reviewboard.mozilla.org/r/65744/diff/12/
So I don't understand why this was not integrated in the Dev Tools until now? Please correct me if I'm wrong.
The same with the eyedropper shortcut: https://bugzilla.mozilla.org/show_bug.cgi?id=1177108
At that time Jeff Griffiths filed this bug only because of my suggestion on the uservoice.com site. It's now more then a year ago and the devs are still discussing about which shortcut they should use!? This is ridiculous, sorry.
And last but not least... the bad syntax highlighting problem is also well known: https://bugzilla.mozilla.org/show_bug.cgi?id=1273130 or https://bugzilla.mozilla.org/show_bug.cgi?id=1281118
For me it seems that there are a lot of people out there who don't like the new dark theme. But what happend until now? Nothing! ;-)

Jshark
Dec 5, 2016, 9:27:11 AM12/5/16
to Firebug
I posted a bunch of my gripes on one of Honza's blog posts from late 2015. He suggested I file tickets in Bugzilla which, sorry to say, I never got around to. Life interferes, you know? Some have been addressed, these are the remaining ones I still find ... annoying. I realize that some/all of these might be "nope, it's the way dev tools works now", and if that's the case then I can accept it, but I might as well get my 2 cents in. Apologies if some of these have already been brought up.
jeff
On Wednesday, April 27, 2016 at 8:06:17 AM UTC-4, Sebastian Zartner wrote:
- debugger search. egads. #linenumber is
engraved in my fingerprints. Finding something in the *current* file now
needs a prefix (excuse me…”operator”)? What is that operator again?
oh, wait, you can’t see those unless the search box is empty. I've managed to remember Ctrl-F most of the time, but I still find myself using "#" instead of ":" about 75% of the time to go to a line number.
- The multi-line command window on the Console tab. Yes, scratchpad is kind of like that, but not really. It was nice having it on Console.
- Back in high school you’d never hear me say this, but “I miss
history”. Especially in the form of the Console Command Editor History
menu. Yes, you can up-arrow through your history, but you don't see what that history actually is until you get there.
- Remembering the source file you had open the last time you opened the debug window on this page.
- Inspector Box Model tab – you can not edit the height/width of the inspected item as you used to be able to do in FB. Everything else, but not height &width.
jeff
On Wednesday, April 27, 2016 at 8:06:17 AM UTC-4, Sebastian Zartner wrote:
The Firefox DevTools team is working on closing the gaps between their tools and Firebug.
In the first quarter of the year the Firebug theme, HTTP log inspection in the Console panel and the DOM panel were ported to Firefox (see bug 1256749).
Now the team is asking what should be fixed in Q2 2016. See bug 1267303.
My suggestions:(These are all existing issues, but you can also suggest issues that are not already tracked in Bugzilla, of course.)
- 1004678: Break on DOM mutation
- 1267144: Allow to set breakpoints for XHRs
- 1165010: Set a breakpoint for errors in WebConsole (like Firebug)
- 1226640: Add Events side panel
- 1227054: [rule view] Show whether a CSS property, value or selector is valid
- 1267140: Allow auto-completing non-enumerable properties and member functions return types of known types
Sebastian
Message has been deleted
joschka...@gmail.com
Dec 5, 2016, 12:17:28 PM12/5/16
to Firebug
Am Montag, 5. Dezember 2016 15:27:11 UTC+1 schrieb Jshark:
Inspector Box Model tab – you can not edit the height/width of the inspected item as you used to be able to do in FB. Everything else, but not height &width.
Yeah Jeff, exactly! This is also a anoying bug in the Box Model view of the Dev Tools!!!

pd
Dec 8, 2016, 7:03:47 AM12/8/16
to Firebug
How many of these items have been implemented Sebastian?

sm...@virtuluxe.com
Dec 8, 2016, 12:36:25 PM12/8/16
to Firebug
I cannot use this new tool at all. Where is the side by side console that allowed multiple line script and loading of scripts from history? I have been using this tool since it's inception and now we are forced to use a different browser.
sm...@virtuluxe.com
Dec 8, 2016, 12:36:25 PM12/8/16
to Firebug
The Firefox dev tools has ruined my development. Now I need to find a new browser to develop one. Sad day.
Erik Krause
Dec 8, 2016, 5:03:29 PM12/8/16
to fir...@googlegroups.com
Am 08.12.2016 um 18:21 schrieb sm...@virtuluxe.com:
> The Firefox dev tools has ruined my development. Now I need to find a new
> browser to develop one. Sad day.
And what is your suggestion? Only to whine is not very productive...
> The Firefox dev tools has ruined my development. Now I need to find a new
> browser to develop one. Sad day.
BTW.: You can always go back to an older firefox version:
https://support.mozilla.org/en-US/kb/install-older-version-of-firefox
David Smith
Dec 8, 2016, 6:20:12 PM12/8/16
to fir...@googlegroups.com
Erik,
I'm not whining, I am lamenting. I said it was a sad day, that is not whining. Whining is long , shrill complaining cry, lamenting is an impassioned expression of grief or sorrow. I can appreciate your asking for suggestions and you are probably tired of people complaining about it and you want to make it better I am sure as you took the time to write as I am taking the time to write this. I do not know what prompted this move, whether it is internal politics, a financial or corporate decision, but it is a monumental change for the people that develop with Firebug. It's like using Photoshop for years then one day it is now some program that sort of does what Photoshop does but it is clunky, missing features and the lasso tool is now called the snare or lariat tool and you have no choice but to use it or find a new application. What do I suggest? Aside from putting the Firebug tools as a replacement for the dev-tools, I don't think there is much you can do, so I feel sad about it. I saw this change coming when Firefox introduced the dev-tools and made it easier to right click to it than to Firebug, I said to my team that this will be the end of Firebug and we will need to use this new tool. It's not so much that they can do the same sort of things but differently, it's also a rote memory issue, I can click anywhere from memory on all the controls of firebug in an instant I know the lasso tool is the third tool from the top left of my window. Now I find myself trying to figure out what this prompt means "The Web Console logging API (console.log, console.info, console.warn, console.error) has been disabled by a script on this page" when I open the console.
There are many good suggestions on the bulletin boards so I don't need to reiterate them.
I used Firebug mostly for logging events, the net features and writing styles. For the console I liked the history function and the side by side console windows where I can add several lines of code, there seems to be a button for split console but it does nothing on my version of Firefox, 40.0.2. Yes, I can stay at the version and continue to run Firebug (I am quite certain that I cannot have two versions on the same Mac) but I have been doing this since '92 and I know when it comes to the dreaded "upgrade" that resistance is futile so it is indeed a sad day to watch Firebug go away.
Sincerely,
David Smith
Virtuluxe
--
You received this message because you are subscribed to a topic in the Google Groups "Firebug" group.
To unsubscribe from this topic, visit https://groups.google.com/d/topic/firebug/Q6eyvGt6hyI/unsubscribe.
To unsubscribe from this group and all its topics, send an email to firebug+unsubscribe@googlegroups.com.
To post to this group, send email to fir...@googlegroups.com.
Visit this group at https://groups.google.com/group/firebug.
To view this discussion on the web visit https://groups.google.com/d/msgid/firebug/1b1cf74b-3290-7eb9-867c-e3fc92baf06c%40gmx.de.
For more options, visit https://groups.google.com/d/optout.
Lawrence San
Dec 8, 2016, 10:25:01 PM12/8/16
to fir...@googlegroups.com
David Smith <sm...@virtuluxe.com> wrote:
Yes, I can stay at the version and continue to run Firebug (I am quite certain that I cannot have two versions on the same Mac)
Luckily -- despite your being "quite certain" -- that's not true, or at least it didn't used to be true. I have a free program called MultiFirefox installed on my Mac, which lets you switch between more than one version of FF, and/or between multiple profiles for the same version. It's a Mac application, not a FF extension, so it shouldn't be affected by the switch to E10s (I hope). I'm not absolutely sure that it still works, since I haven't used it with a recent version of FF, but it seems to still be under development (updated) so it probably still works.
Alternatively, this page describes using the Mac's command line, or an AppleScript that the author wrote, to accomplish something similar -- switching between more than one FF installation on the same Mac. (I haven't tried his methods.)
(BTW, don't confuse the application MultiFirefox with the FF extension Multifox; that's unrelated and has an entirely different purpose.)
For Windows users, if you search for something like "multi firefox for windows" or "install multiple versions of Firefox on Windows" you'll find many web pages with instructions, although I haven't tried any of them.
The broader question is how convenient it would be to use a separate browser for development and for ordinary browsing. Currently I'm more interested in learning the Mozilla DevTools, but if a future version of FF kills off more key extensions that I use, I might start developing in an older version, or try one of the extended support releases.

Srđan Mahmutović
Dec 9, 2016, 12:24:26 PM12/9/16
to Firebug
What have you done Firebug. Oh my god what have you done. You've crippled our development and the way we do things. I and my whole dev team is frustrated with the "new" and "upgraded" firebug. What you've done with this upgrade is a mistake of the decade and undermines all the great work you guys have put into it in the last 5 yrs.
Why did you force me to use the new version? I don't know where to start explaining how the "new" version is a piece of s...
Does anyone know of an alternative to Firebug? It's a shame we lost such a great tool.
Why did you force me to use the new version? I don't know where to start explaining how the "new" version is a piece of s...
Does anyone know of an alternative to Firebug? It's a shame we lost such a great tool.
Erik Krause
Dec 9, 2016, 3:06:23 PM12/9/16
to fir...@googlegroups.com
Am 09.12.2016 um 04:24 schrieb Lawrence San:
> For Windows users, if you search for something like "multi firefox for
> windows" or "install multiple versions of Firefox on Windows" you'll find
> many web pages with instructions, although I haven't tried any of them.
On windows you simply install in a different folder.
> For Windows users, if you search for something like "multi firefox for
> windows" or "install multiple versions of Firefox on Windows" you'll find
> many web pages with instructions, although I haven't tried any of them.
Erik Krause
Dec 9, 2016, 3:09:08 PM12/9/16
to fir...@googlegroups.com
Am 09.12.2016 um 00:19 schrieb David Smith:
> I do not know what prompted this move,
> whether it is internal politics, a financial or corporate decision, but it
> is a monumental change for the people that develop with Firebug.
Firebug was an extension to Firefox, built by volunteers. There where
> I do not know what prompted this move,
> whether it is internal politics, a financial or corporate decision, but it
> is a monumental change for the people that develop with Firebug.
not enough of them to switch to multi process architecture. The devtools
are built-in, they come from mozilla. The change was announced more than
one year ago and when I looked at the devtools then I was not confident
that this would work out until we where forced to change, since I knew
the pace at which bugs where fixed in firefox.
However, to my surprise the devtools team made relatively good progress.
The devtools are more or less usable now and in some aspects even better
than firebug. Source map support is inevitable for sass developers (and
probaly for other uses, too), the small ev buttons showing what events
are on a specific HTML element are really nice, as well as the
highlighting of corresponding html end tags. Same for the quick filter
on CSS (to name only few of those I found). And I think there's still a
lot to discover.
So you, who are working in the fastest changing industry in the world,
be a bit more flexible and give a new tool a chance. And go to bugzilla
and vote for the bugs that annoy you most.
Srđan Mahmutović
Dec 9, 2016, 3:37:55 PM12/9/16
to fir...@googlegroups.com
I've reverted to the previous ff version. Hoping the guys will close the gap soon.
9. dec. 2016 21:06 je oseba "Erik Krause" <erik....@gmx.de> napisala:
--
You received this message because you are subscribed to a topic in the Google Groups "Firebug" group.
To unsubscribe from this topic, visit https://groups.google.com/d/topic/firebug/Q6eyvGt6hyI/unsubscribe.
To unsubscribe from this group and all its topics, send an email to firebug+unsubscribe@googlegroups.com.
To post to this group, send email to fir...@googlegroups.com.
Visit this group at https://groups.google.com/group/firebug.
To view this discussion on the web visit https://groups.google.com/d/msgid/firebug/2ae4398b-4163-f849-2081-992339e12d62%40gmx.de.
Denis Chenu
Dec 9, 2016, 5:14:43 PM12/9/16
to Firebug
Hi,
Soory, i just bounce on a sentence
Soory, i just bounce on a sentence
Le vendredi 9 décembre 2016 21:09:08 UTC+1, Erik Krause a écrit :
So you, who are working in the fastest changing industry in the world,
be a bit more flexible and give a new tool a chance. And go to bugzilla
and vote for the bugs that annoy you most.
Right, and more : Firefox DevTools is a free tool : you want to improve it : hack it, this is allowed.
You like FireBug and you need it : same think : it's a free tool : you can fork it https://github.com/firebug/firebug and hack it.
Regards,
Denis
You like FireBug and you need it : same think : it's a free tool : you can fork it https://github.com/firebug/firebug and hack it.
Regards,
Denis
alfonsoml
Dec 10, 2016, 5:11:36 PM12/10/16
to Firebug
The really sad part about all of this, is that except Jan Honza, none other of the developers of the Firefox DevTools did bother to look at this forum to look and reply at the comments of the people that used Firebug, They just went forward with their ideas about what a "developer tools" should look like, without listening to other developers, putting Firefox in a situation where the former tool no longer works and there are gaps missing in the new one, so people is being forced to always debug with other tools.
I try to keep an open mind and use all the browsers a little, rotate the usage, understand what are the improvements that each dev tools have, but so far I still haven't found anything that makes the native DevTools of Firefox anything special. It includes options that I will never use, but it lacks features that were present in Firebug. So currently Firefox is my last option when I want to debug something complex.
I try to keep an open mind and use all the browsers a little, rotate the usage, understand what are the improvements that each dev tools have, but so far I still haven't found anything that makes the native DevTools of Firefox anything special. It includes options that I will never use, but it lacks features that were present in Firebug. So currently Firefox is my last option when I want to debug something complex.
Denis Chenu
Dec 11, 2016, 6:22:31 AM12/11/16
to Firebug
Hi,
Working on another free tool, i really like to have all bug at one place.
Maybe the best is to put bug report on the best place : https://bugzilla.mozilla.org . See https://bugzilla.mozilla.org/show_bug.cgi?id=991806 for example ?
Working on another free tool, i really like to have all bug at one place.
Maybe the best is to put bug report on the best place : https://bugzilla.mozilla.org . See https://bugzilla.mozilla.org/show_bug.cgi?id=991806 for example ?
Erik Krause
Dec 11, 2016, 9:53:51 AM12/11/16
to fir...@googlegroups.com
Am 10.12.2016 um 23:11 schrieb alfonsoml:
> The really sad part about all of this, is that except Jan Honza, none other
> of the developers of the Firefox DevTools did bother to look at this forum
> to look and reply at the comments of the people that used Firebug
You forgot Sebastian Zartner. But apart of that there aren't much more:
> The really sad part about all of this, is that except Jan Honza, none other
> of the developers of the Firefox DevTools did bother to look at this forum
> to look and reply at the comments of the people that used Firebug
https://github.com/firebug/firebug/graphs/contributors
But please! This is off topic. Instead of lamenting better contribute
suggestions for gaps that need to be closed.
As Denis wrote: in https://bugzilla.mozilla.org/show_bug.cgi?id=991806
you find a dependency list which collects all the gaps. Mouse over the
numbers to get the headline. Vote for the bugs that annoy you most.
And many things work already. Read the migration guide. :
https://developer.mozilla.org/en-US/docs/Tools/Migrating_from_Firebug

Arvis Pinkletter
Dec 16, 2016, 10:17:41 AM12/16/16
to Firebug
The Debugger tab - in "sources", when I am working on a site where you have to log in to see the page, I need the "source" of the page I'm working on to be the same as the one in the browser, that is, if I'm logged into the site, the source in the debugger tab for that page should also be the "logged in" version of the page. Our pages redirect you to a login page if you aren't logged in, so currently, in my "source" tab if I'm trying to work on something, I see the markup and scripting for the login page instead of the page I actually want. What's weird about this is that the "inspector" tab has the right content, but not the debugger tab.
Also, scrolling up and down in the debugger tab isn't as nice as in the inspector tab; I can't use my mouse pointer on the scroll bar - I have to use my wheel or my keyboard to page up and down.
Also, scrolling up and down in the debugger tab isn't as nice as in the inspector tab; I can't use my mouse pointer on the scroll bar - I have to use my wheel or my keyboard to page up and down.
Arvis Pinkletter
Dec 16, 2016, 3:25:30 PM12/16/16
to Firebug
Console Tab:
XHR requests have "Headers", "POST", "Response", "Call Stack".
Need these that Firebug had: "JSON" (the nicely navigable JSON object that is the Response), and "Cookies"
Sebastian Zartner
Dec 19, 2016, 2:36:18 AM12/19/16
to Firebug
Sorry for the extreme delay on this!
On Thursday, December 8, 2016 at 1:03:47 PM UTC+1, pd wrote:
How many of these items have been implemented Sebastian?
These are the suggestions for what should get implemented. They are not implemented yet. Though what I've heard, they will be worked on in the first quarter of 2017.
On Thursday, December 8, 2016 at 6:36:25 PM UTC+1, sm...@virtuluxe.com wrote:
I cannot use this new tool at all. Where is the side by side console that allowed multiple line script and loading of scripts from history? I have been using this tool since it's inception and now we are forced to use a different browser.
Instead of the Command Editor, there is a tool called Scratchpad, which works more or less the same. Also, you can add a line break while typing into the command line by pressing Shift+Enter. Furthermore, there's a request for adding a multi-line editor to the command line.
On Thursday, December 8, 2016 at 6:36:25 PM UTC+1, David Smith wrote:
The Firefox dev tools has ruined my development. Now I need to find a new browser to develop one. Sad day.
This is the chance to explain why exactly they're not sufficient for you.
On Friday, December 9, 2016 at 12:20:12 AM UTC+1, David Smith wrote:
I do not know what prompted this move
See the point "What about Firebug 2" in the latest related blog post and also former blog posts about this.
It's not so much that they can do the same sort of things but differently, it's also a rote memory issue
For this reason I've created a migration guide. It's not complete yet, though, so anyone willing to help, please do so!
Now I find myself trying to figure out what this prompt means "The Web Console logging API (console.log, console.info, console.warn, console.error) has been disabled by a script on this page" when I open the console.
That means that you probably had Firebug open before the DevTools. Firebug injects the console object into the page and the DevTools don't overwrite it with their console object when it's already defined. So, just deactivate Firebug and reload the page.
On Friday, December 9, 2016 at 4:25:01 AM UTC+1, San wrote:
David Smith <sm...@virtuluxe.com> wrote:Yes, I can stay at the version and continue to run Firebug (I am quite certain that I cannot have two versions on the same Mac)
Luckily -- despite your being "quite certain" -- that's not true, or at least it didn't used to be true. I have a free program called MultiFirefox installed on my Mac...
I don't know how you do it on Mac, though on Windows it is very easy. You just choose another installation directory when installing it and that's it.
Anyway, staying at an old Firefox version is not a longterm solution, because you'll miss the platform features the new versions introduce.
On Friday, December 9, 2016 at 9:09:08 PM UTC+1, Erik Krause wrote:
Am 09.12.2016 um 00:19 schrieb David Smith:
> I do not know what prompted this move,
> whether it is internal politics, a financial or corporate decision, but it
> is a monumental change for the people that develop with Firebug.
Firebug was an extension to Firefox, built by volunteers. There where
not enough of them to switch to multi process architecture. The devtools
are built-in, they come from mozilla. ...
The devtools are more or less usable now and in some aspects even better
than firebug. ...
So you, who are working in the fastest changing industry in the world,
be a bit more flexible and give a new tool a chance. And go to bugzilla
and vote for the bugs that annoy you most.
My words. Thank you, Erik!
Yes, the DevTools are currently missing some of Firebug's features and are slower, though they already have many more features than Firebug and also have some features even the Chrome DevTools don't offer yet like the upcoming CSS Grid Inspector.
On Saturday, December 10, 2016 at 11:11:36 PM UTC+1, alfonsoml wrote:
I try to keep an open mind and use all the browsers a little, rotate the usage, understand what are the improvements that each dev tools have, but so far I still haven't found anything that makes the native DevTools of Firefox anything special.
It includes options that I will never use, but it lacks features that were present in Firebug. So currently Firefox is my last option when I want to debug something complex.
If you have specific features in mind which were not mentioned yet, please share them.
On Sunday, December 11, 2016 at 12:22:31 PM UTC+1, Denis Chenu wrote:
Maybe the best is to put bug report on the best place : https://bugzilla.mozilla.org . See https://bugzilla.mozilla.org/show_bug.cgi?id=991806 for example ?
Correct. If you miss anything not blocking bug 991806 yet, please file a new bug in Bugzilla and mark it as blocker of 991806.
On Friday, December 16, 2016 at 4:17:41 PM UTC+1, Arvis Pinkletter wrote:
The Debugger tab - in "sources", when I am working on a site where you have to log in to see the page, I need the "source" of the page I'm working on to be the same as the one in the browser, that is, if I'm logged into the site, the source in the debugger tab for that page should also be the "logged in" version of the page. Our pages redirect you to a login page if you aren't logged in, so currently, in my "source" tab if I'm trying to work on something, I see the markup and scripting for the login page instead of the page I actually want. What's weird about this is that the "inspector" tab has the right content, but not the debugger tab.
Do you have a URL, so this can be reproduced? Did Firebug (before Firefox 50) show different results?
Also, scrolling up and down in the debugger tab isn't as nice as in the inspector tab; I can't use my mouse pointer on the scroll bar - I have to use my wheel or my keyboard to page up and down.
The Debugger panel is currently reworked for a better UI and to be independent of the DevTools. You may try it out in the latest Developer Editions and Nightlies of Firefox. Try it out and let them know if it's still not working for you.
The JSON structure is available inside the Response tab. I'll add that to the migration guide.
Sebastian
Sebastian
Arvis Pinkletter
Dec 19, 2016, 10:57:40 AM12/19/16
to Firebug
On Monday, 19 December 2016 02:36:18 UTC-5, Sebastian Zartner wrote:
On Friday, December 16, 2016 at 4:17:41 PM UTC+1, Arvis Pinkletter wrote:The Debugger tab - in "sources", when I am working on a site where you have to log in to see the page, I need the "source" of the page I'm working on to be the same as the one in the browser, that is, if I'm logged into the site, the source in the debugger tab for that page should also be the "logged in" version of the page. Our pages redirect you to a login page if you aren't logged in, so currently, in my "source" tab if I'm trying to work on something, I see the markup and scripting for the login page instead of the page I actually want. What's weird about this is that the "inspector" tab has the right content, but not the debugger tab.
Do you have a URL, so this can be reproduced? Did Firebug (before Firefox 50) show different results?
Due to security reasons, I can't disclose a URL. But I can suggest this: log in to gmail. You ought to be on a page with a URL that looks like https://mail.google.com/mail/u/0/#inbox .... open up the Debugger, and find mail/u/0/ in the sources. The source there ought to have links for "sign in", "create an account", "get gmail", etc, while the browser's viewport shows your inbox and not have those links. One thing I find weird about this is that the "inspector" tab agrees with the viewport.
And yes, in firebug, when the script tab still worked, it showed sources that matched the viewport.
Also, scrolling up and down in the debugger tab isn't as nice as in the inspector tab; I can't use my mouse pointer on the scroll bar - I have to use my wheel or my keyboard to page up and down.
The Debugger panel is currently reworked for a better UI and to be independent of the DevTools. You may try it out in the latest Developer Editions and Nightlies of Firefox. Try it out and let them know if it's still not working for you.
OK, I grabbed the latest Developer Edition. Good news is that the sources match the viewport. The vertical scrollbar on the source pane is sometimes clickable, if I point my mouse on the exact perfect pixel, occasionally, but I can't find a predictable way to make it always work. The vertical scrollbar in the inspector works nicely when clicked, and I can drag the scroll-cursor up and down at my leisure.
On Friday, December 16, 2016 at 9:25:30 PM UTC+1, Arvis Pinkletter wrote:Console Tab:XHR requests have "Headers", "POST", "Response", "Call Stack".Need these that Firebug had: "JSON" (the nicely navigable JSON object that is the Response), and "Cookies"The JSON structure is available inside the Response tab. I'll add that to the migration guide.
Ah, I see. If I click the arrow next to my request, the response tab there will show the JSON object tree after I click on "Size limit has been reached. Click here to load more." I had thought it would just load the rest of the Raw Data. If I click on the request itselt, then I get all kinds of goodies, including cookies and a nice filter for properties. This is good stuff; I will just have to get used to using it.
Thanks.
Sebastian Zartner
Dec 23, 2016, 9:37:00 AM12/23/16
to Firebug
On Monday, December 19, 2016 at 4:57:40 PM UTC+1, Arvis Pinkletter wrote:
On Monday, 19 December 2016 02:36:18 UTC-5, Sebastian Zartner wrote:On Friday, December 16, 2016 at 4:17:41 PM UTC+1, Arvis Pinkletter wrote:The Debugger tab - in "sources", when I am working on a site where you have to log in to see the page, I need the "source" of the page I'm working on to be the same as the one in the browser, that is, if I'm logged into the site, the source in the debugger tab for that page should also be the "logged in" version of the page. Our pages redirect you to a login page if you aren't logged in, so currently, in my "source" tab if I'm trying to work on something, I see the markup and scripting for the login page instead of the page I actually want. What's weird about this is that the "inspector" tab has the right content, but not the debugger tab.
Do you have a URL, so this can be reproduced? Did Firebug (before Firefox 50) show different results?Due to security reasons, I can't disclose a URL. But I can suggest this: log in to gmail. You ought to be on a page with a URL that looks like https://mail.google.com/mail/u/0/#inbox .... open up the Debugger, and find mail/u/0/ in the sources. The source there ought to have links for "sign in", "create an account", "get gmail", etc, while the browser's viewport shows your inbox and not have those links. One thing I find weird about this is that the "inspector" tab agrees with the viewport.And yes, in firebug, when the script tab still worked, it showed sources that matched the viewport.
Hmm, I tested this with Firefox 49.0.2 and Firebug 2.0.18 right now and I couldn't find "create an account" or "get gmail" when I'm signed in.
Though I think you are talking about dynamically evaluated scripts, i.e. JavaScript generated dynamically, e.g. via eval() or by inserting a <script> tag via appendChild(). There is a difference between Firebug and the DevTools in this regard. Firebug shows all dynamically evaluated scripts automatically while the Debugger in the DevTools only lists them when they have a
//# sourceURL comment at the end.Note that both tools show you the static source when you look at mail/u/0/ within the Script/Debugger panels, though the HTML/Inspector panels show a live view of the HTML. That means, changes to the DOM update the source shown in the HTML structure, though the source within the JavaScript debugger stays unchanged.
Is it that what you mean?
Also, scrolling up and down in the debugger tab isn't as nice as in the inspector tab; I can't use my mouse pointer on the scroll bar - I have to use my wheel or my keyboard to page up and down.
The Debugger panel is currently reworked for a better UI and to be independent of the DevTools. You may try it out in the latest Developer Editions and Nightlies of Firefox. Try it out and let them know if it's still not working for you.OK, I grabbed the latest Developer Edition. Good news is that the sources match the viewport.
Good! If I was wrong above, I'd still be interested in a simple reproducible test case to understand what you meant.
The vertical scrollbar on the source pane is sometimes clickable, if I point my mouse on the exact perfect pixel, occasionally, but I can't find a predictable way to make it always work. The vertical scrollbar in the inspector works nicely when clicked, and I can drag the scroll-cursor up and down at my leisure.
I saw that issue, too. I've filed it now as bug 1325604. Please add your notes if I missed something.
On Friday, December 16, 2016 at 9:25:30 PM UTC+1, Arvis Pinkletter wrote:Console Tab:XHR requests have "Headers", "POST", "Response", "Call Stack".Need these that Firebug had: "JSON" (the nicely navigable JSON object that is the Response), and "Cookies"The JSON structure is available inside the Response tab. I'll add that to the migration guide.Ah, I see. If I click the arrow next to my request, the response tab there will show the JSON object tree after I click on "Size limit has been reached. Click here to load more." I had thought it would just load the rest of the Raw Data.
Right, the UI related to that is not that good yet. I think I've already filed a bug about that, though I can't find it at the moment.
Sebastian
Arvis Pinkletter
Jan 3, 2017, 1:47:50 PM1/3/17
to Firebug
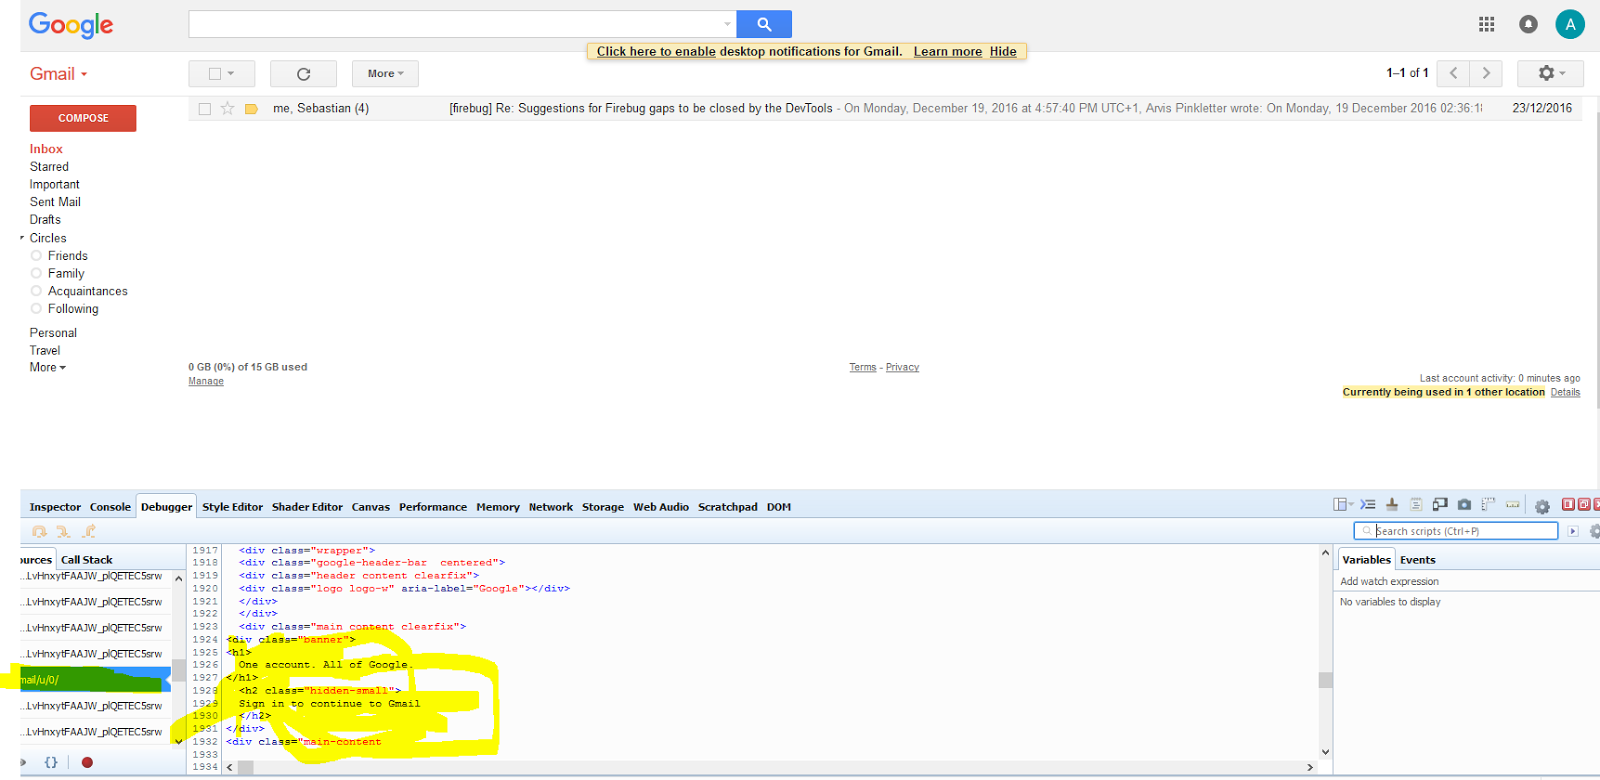

I have attached screenshots to illustrate. If I log in to the site, in my gmail account, I can find your email address in the inspector, but in the debugger tab, I cannot find it, in any of the files. The source for https://mail.google.com/mail/u/0/#inbox in the debugger tab looks suspiciously identical to the page that I get redirected to if I try to visit https://mail.google.com/mail/u/0/#inbox without being logged in.
Applying this to the context of my work: if I have a page that is behind a "login wall" so-to-speak, and that page contains javascript, if I put in a "debugger" statement in that page, the debugger tab does not show me my "debugger" statement when it pauses, but instead shows the code paused at some line in my login page, because, I am just guessing here, the debugger tab is loading the sources without using session cookies.
Sebastian Zartner
Jan 5, 2017, 4:19:38 AM1/5/17
to Firebug
Happy New Year everyone!
I can see your problem, Arvis. The Gmail issue is
related to what I wrote in my previous comment, though it sounds to be a
bug. Though I cannot reproduce it, unfortunately. For me the contents of the mail/u/0/ source look like this:

You should do two things. First, create a fresh Firefox profile and try it there. If that doesn't help, try out the Developer Edition or Nightly of Firefox, which have a new debugger UI and see if it works for you there. If that still doesn't work for you, you should file a bug for the DevTools and, if possible, attach a simple test case, so people can reproduce it. If you file a bug, please post the link to it here for back reference.
Sebastian
Arvis Pinkletter
Jan 6, 2017, 11:58:15 AM1/6/17
to Firebug
On Thursday, 5 January 2017 04:19:38 UTC-5, Sebastian Zartner wrote:
Happy New Year everyone!
I can see your problem, Arvis. The Gmail issue is related to what I wrote in my previous comment, though it sounds to be a bug. Though I cannot reproduce it, unfortunately. For me the contents of the mail/u/0/ source look like this:
You should do two things. First, create a fresh Firefox profile and try it there. If that doesn't help, try out the Developer Edition or Nightly of Firefox, which have a new debugger UI and see if it works for you there. If that still doesn't work for you, you should file a bug for the DevTools and, if possible, attach a simple test case, so people can reproduce it. If you file a bug, please post the link to it here for back reference.
Sebastian
I figured it out. After installing developer edition freshly, the debugger tab worked, but I remembered that I have a lot of personal preferences set in my "regular" firefox browser. As soon as I went to privacy and set it to "never remember history", then my debugger problem appeared. I'm unsure what the expectation should be here, as I've had my browser set that way for years and firebug never used to care (the source tab still worked), but dev toolbar does care about this setting. If I use "custom settings" for history, check "remember browsing history", and check "clear everything on close", the debugger tab works, but if "always use private browsing mode" is checked, it does not. I don't know if this is a bug, but it warrants documentation if it isn't.
Sebastian Zartner
Jan 15, 2017, 12:24:43 PM1/15/17
to Firebug
Excuse my very late reply! Good to know that it worked with the fresh install of the Developer Edition!
You can copy over your preferences by switching to the profile folder and copying the prefs.js file to your new profile. The profile folder can be opened via Firefox menu > ? > Troubleshooting Information > Open Folder.
I can reproduce the issue in Private Browsing Mode, though I can't say yet whether that's a bug or not. So far, it looks to me like one, because the response for /mail/u/0 in the Network Monitor looks different than the source in the Debugger.
This can probably better be answered by the DevTools team. So, you may ask them on IRC or put that question up on Stack Overflow.
Sebastian
David Wheeler
Jan 31, 2017, 3:06:46 AM1/31/17
to Firebug
On Tuesday, November 22, 2016 at 4:38:05 PM UTC-7, Sebastian Zartner wrote:
On Tuesday, November 22, 2016 at 3:38:42 PM UTC+1, Erik Krause wrote:Am 22.11.2016 um 13:59 schrieb Sebastian Zartner:
> Please let us know the most pressing things you're missing!
Shall we add things even if there is already a bug on bugzilla?
Yes, of course! The point of this thread is to tell the DevTools people what the Firebug users are missing most, so they can do some prioritization. If you know the bug number, please share it here.
Definitely 1319079. What a kick in the nuts to linux users. This isn't even READABLE on my arch system, and by April (when this bug fix is planned for release), I wll have gotten too used to the built-in theme to even considere going to this new firebug theme.

Nick Odaemus
Feb 1, 2017, 7:45:20 AM2/1/17
to Firebug
Will there be any Xpath utilities, such as what FirePath covered?

Andrew Carlisle
Feb 1, 2017, 2:06:37 PM2/1/17
to Firebug
Hey there, when I opened Firebug today and discovered the changes, my heart sank. Gone is the html editor pane and the ability to edit html with one click of the edit button. Now it seems I need to right click and choose 'Edit as html' from the contextual menu. Plus, changes need to be 'committed' by clicking outside the inline editor window before they are rendered. Ouch. Sure, this is the same behaviour as the Chrome debugger. But that's precisely why I don't use Chrome for Web development work. For years, I've used Firefox and Firebug because of Firebug's great advantages for creating Web mock-ups from live code. I guess those days are over.
Sebastian Zartner
Feb 2, 2017, 6:15:05 AM2/2/17
to Firebug
On Wednesday, February 1, 2017 at 1:45:20 PM UTC+1, Nick Odaemus wrote:
Will there be any Xpath utilities, such as what FirePath covered?
Please see my answer in another thread.
On Wednesday, February 1, 2017 at 8:06:37 PM UTC+1, Andrew Carlisle wrote:
Hey there, when I opened Firebug today and discovered the changes, my heart sank. Gone is the html editor pane and the ability to edit html with one click of the edit button. Now it seems I need to right click and choose 'Edit as html' from the contextual menu.
You can edit it by pressing F2.
Plus, changes need to be 'committed' by clicking outside the inline editor window before they are rendered.
teo venier
Feb 2, 2017, 7:54:25 AM2/2/17
to fir...@googlegroups.com
Every time I hover a variable while debugging to see it value, the entire devtools "reload", only to show a popup. Worst, if I have some object in variable panel "expadend" (?) Devtools close it when reloading.
The only way to close this "popup" are click somewhere else, not only hover out like firebug. I cant hover another variable while I dont close the first.
So, I cant compare hover variable against value of property in an object. I need to put both in watch...
I think it will be necessary to break into several bugs to find a complete solution.
Sorry my bad english.
--
You received this message because you are subscribed to a topic in the Google Groups "Firebug" group.
To unsubscribe from this topic, visit https://groups.google.com/d/topic/firebug/Q6eyvGt6hyI/unsubscribe.
To unsubscribe from this group and all its topics, send an email to firebug+unsubscribe@googlegroups.com.
To post to this group, send email to fir...@googlegroups.com.
Visit this group at https://groups.google.com/group/firebug.
To view this discussion on the web visit https://groups.google.com/d/msgid/firebug/0189e797-9750-4ed1-bc3a-a6c54a98b343%40googlegroups.com.
Sebastian Zartner
Feb 2, 2017, 9:07:16 AM2/2/17
to Firebug
On Thursday, February 2, 2017 at 1:54:25 PM UTC+1, teo venier wrote:
Every time I hover a variable while debugging to see it value, the entire devtools "reload", only to show a popup.
The DevTools team is currently reworking the debugger UI. This issue may be gone in that new UI.
Worst, if I have some object in variable panel "expadend" (?) Devtools close it when reloading.
This works fine for me in Firefox 51.0.1, i.e. the expanded variable tree stays expanded when stepping through the code. But, again, the UI is currently reworked, so please have a look whether that's an issue in the new UI. Try out Firefox Nightly to see the new UI.
Having said that, Firebug closed the tree on every step, so this is not a "Firebug gap".
The only way to close this "popup" are click somewhere else, not only hover out like firebug. I cant hover another variable while I dont close the first.So, I cant compare hover variable against value of property in an object. I need to put both in watch...
I think it will be necessary to break into several bugs to find a complete solution.
All valid points.
In the new UI, watch expressions and the popup are not released yet. See issue #916. So, let's wait until they landed in Firefox Nightly and check again.
Sorry my bad english.
It's actually quite good! :-)
Sebastian
Em 2 de fev de 2017 9:15 AM, "Sebastian Zartner" <sebastia...@gmail.com> escreveu:
On Wednesday, February 1, 2017 at 1:45:20 PM UTC+1, Nick Odaemus wrote:Will there be any Xpath utilities, such as what FirePath covered?
Please see my answer in another thread.
On Wednesday, February 1, 2017 at 8:06:37 PM UTC+1, Andrew Carlisle wrote:Hey there, when I opened Firebug today and discovered the changes, my heart sank. Gone is the html editor pane and the ability to edit html with one click of the edit button. Now it seems I need to right click and choose 'Edit as html' from the contextual menu.
You can edit it by pressing F2.
Plus, changes need to be 'committed' by clicking outside the inline editor window before they are rendered.
--
You received this message because you are subscribed to a topic in the Google Groups "Firebug" group.
To unsubscribe from this topic, visit https://groups.google.com/d/topic/firebug/Q6eyvGt6hyI/unsubscribe.
To unsubscribe from this group and all its topics, send an email to firebug+u...@googlegroups.com.
To post to this group, send email to fir...@googlegroups.com.
Visit this group at https://groups.google.com/group/firebug.
teo venier
Feb 2, 2017, 2:43:17 PM2/2/17
to fir...@googlegroups.com
Thank you for quick answer. I will take a look at the nightly.
Teo Venier
PS: Sorry if I seem to be using a rude tone, is to avoid misspelling or misunderstanding
To unsubscribe from this group and all its topics, send an email to firebug+unsubscribe@googlegroups.com.
To post to this group, send email to fir...@googlegroups.com.
Visit this group at https://groups.google.com/group/firebug.
To view this discussion on the web visit https://groups.google.com/d/msgid/firebug/f937bd12-401e-43df-8073-693c268b9990%40googlegroups.com.

metaltapi menye
Feb 3, 2017, 6:34:27 AM2/3/17
to Firebug
it think whats felts so off on scratchpad is sometimes people just want to select dom elements like $('div'); on jquery to just check does it exist, and in scratchpad this kind of command wont show anything. thanks Jshark to mention it, i almost think that scratchpad broken when the first time i Run it, have to write $('div').append('asdfsad') to see it in action.
maybe many people that build their working method with console.log() while developing their web. this method building work flow like "talking" trough console to what they work on (web page), and when we have to talk limited in one line only, its feels off since in real code one liner is quite savage :)
On Monday, December 5, 2016 at 9:27:11 PM UTC+7, Jshark wrote:
I posted a bunch of my gripes on one of Honza's blog posts from late 2015. He suggested I file tickets in Bugzilla which, sorry to say, I never got around to. Life interferes, you know? Some have been addressed, these are the remaining ones I still find ... annoying. I realize that some/all of these might be "nope, it's the way dev tools works now", and if that's the case then I can accept it, but I might as well get my 2 cents in. Apologies if some of these have already been brought up.thx
- debugger search. egads. #linenumber is engraved in my fingerprints. Finding something in the *current* file now needs a prefix (excuse me…”operator”)? What is that operator again? oh, wait, you can’t see those unless the search box is empty. I've managed to remember Ctrl-F most of the time, but I still find myself using "#" instead of ":" about 75% of the time to go to a line number.
- The multi-line command window on the Console tab. Yes, scratchpad is kind of like that, but not really. It was nice having it on Console.
- Back in high school you’d never hear me say this, but “I miss history”. Especially in the form of the Console Command Editor History menu. Yes, you can up-arrow through your history, but you don't see what that history actually is until you get there.
- Remembering the source file you had open the last time you opened the debug window on this page.
- Inspector Box Model tab – you can not edit the height/width of the inspected item as you used to be able to do in FB. Everything else, but not height &width.
jeff
Sebastian Zartner
Feb 3, 2017, 8:42:32 AM2/3/17
to Firebug
Yeah, the Scratchpad UX regarding the output is quite poor. Therefore, there's bug 836849 asking to improve the output when clicking the Display button. And there's also bug 1133849 asking for a Command Editor like Firebug had it.
Sebastian
Sebastian

saifullah fahad
Mar 6, 2017, 5:48:16 AM3/6/17
to Firebug
i can not download firebug .please help me
Reply all
Reply to author
Forward
0 new messages